Tlingit-Haida vs Immigrants from Syria 12th Grade, No Diploma
COMPARE
Tlingit-Haida
Immigrants from Syria
12th Grade, No Diploma
12th Grade, No Diploma Comparison
Tlingit-Haida
Immigrants from Syria
93.0%
12TH GRADE, NO DIPLOMA
99.8/ 100
METRIC RATING
38th/ 347
METRIC RANK
91.1%
12TH GRADE, NO DIPLOMA
40.3/ 100
METRIC RATING
180th/ 347
METRIC RANK
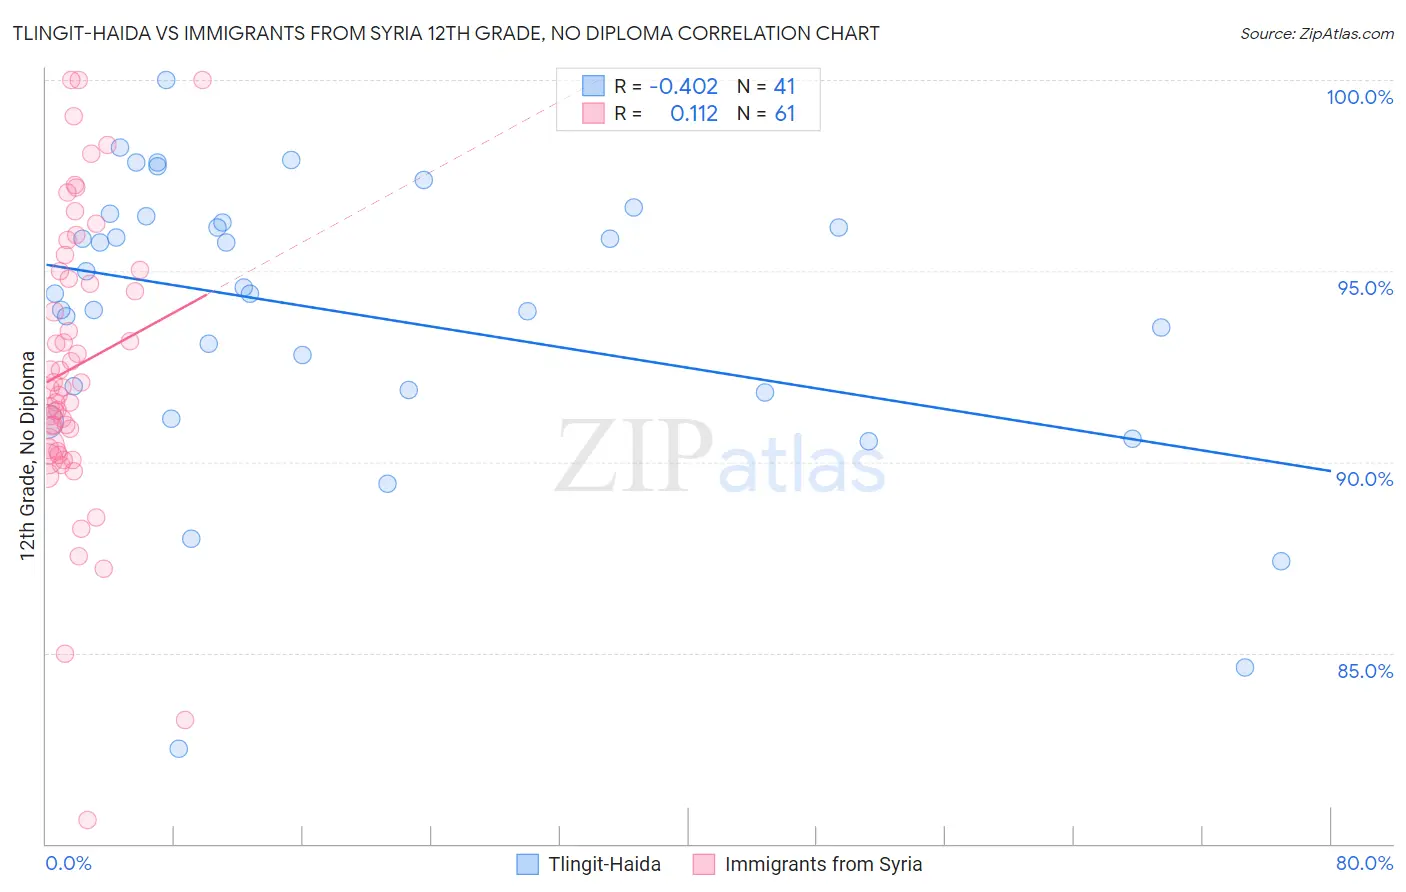
Tlingit-Haida vs Immigrants from Syria 12th Grade, No Diploma Correlation Chart
The statistical analysis conducted on geographies consisting of 60,871,919 people shows a moderate negative correlation between the proportion of Tlingit-Haida and percentage of population with at least 12th grade (no diploma) education in the United States with a correlation coefficient (R) of -0.402 and weighted average of 93.0%. Similarly, the statistical analysis conducted on geographies consisting of 174,108,882 people shows a poor positive correlation between the proportion of Immigrants from Syria and percentage of population with at least 12th grade (no diploma) education in the United States with a correlation coefficient (R) of 0.112 and weighted average of 91.1%, a difference of 2.1%.
12th Grade, No Diploma Correlation Summary
| Measurement | Tlingit-Haida | Immigrants from Syria |
| Minimum | 82.5% | 80.6% |
| Maximum | 100.0% | 100.0% |
| Range | 17.5% | 19.4% |
| Mean | 93.9% | 92.5% |
| Median | 94.4% | 92.0% |
| Interquartile 25% (IQ1) | 91.8% | 90.3% |
| Interquartile 75% (IQ3) | 96.3% | 95.0% |
| Interquartile Range (IQR) | 4.5% | 4.7% |
| Standard Deviation (Sample) | 3.7% | 3.8% |
| Standard Deviation (Population) | 3.7% | 3.8% |
Similar Demographics by 12th Grade, No Diploma
Demographics Similar to Tlingit-Haida by 12th Grade, No Diploma
In terms of 12th grade, no diploma, the demographic groups most similar to Tlingit-Haida are Immigrants from Austria (93.0%, a difference of 0.010%), Turkish (93.0%, a difference of 0.010%), Bhutanese (93.0%, a difference of 0.010%), Scottish (93.0%, a difference of 0.030%), and Irish (93.0%, a difference of 0.030%).
| Demographics | Rating | Rank | 12th Grade, No Diploma |
| Immigrants | Ireland | 99.9 /100 | #31 | Exceptional 93.1% |
| Europeans | 99.9 /100 | #32 | Exceptional 93.1% |
| Immigrants | Scotland | 99.9 /100 | #33 | Exceptional 93.0% |
| Okinawans | 99.9 /100 | #34 | Exceptional 93.0% |
| English | 99.9 /100 | #35 | Exceptional 93.0% |
| Scottish | 99.9 /100 | #36 | Exceptional 93.0% |
| Irish | 99.9 /100 | #37 | Exceptional 93.0% |
| Tlingit-Haida | 99.8 /100 | #38 | Exceptional 93.0% |
| Immigrants | Austria | 99.8 /100 | #39 | Exceptional 93.0% |
| Turks | 99.8 /100 | #40 | Exceptional 93.0% |
| Bhutanese | 99.8 /100 | #41 | Exceptional 93.0% |
| Immigrants | Australia | 99.8 /100 | #42 | Exceptional 92.9% |
| Northern Europeans | 99.8 /100 | #43 | Exceptional 92.9% |
| Dutch | 99.8 /100 | #44 | Exceptional 92.9% |
| Greeks | 99.8 /100 | #45 | Exceptional 92.9% |
Demographics Similar to Immigrants from Syria by 12th Grade, No Diploma
In terms of 12th grade, no diploma, the demographic groups most similar to Immigrants from Syria are Guamanian/Chamorro (91.0%, a difference of 0.010%), Nonimmigrants (91.0%, a difference of 0.020%), Osage (91.0%, a difference of 0.020%), Spanish (91.1%, a difference of 0.040%), and Immigrants from Chile (91.1%, a difference of 0.040%).
| Demographics | Rating | Rank | 12th Grade, No Diploma |
| Bolivians | 50.4 /100 | #173 | Average 91.2% |
| Immigrants | Nepal | 50.0 /100 | #174 | Average 91.2% |
| Immigrants | Western Asia | 49.0 /100 | #175 | Average 91.2% |
| Iroquois | 48.5 /100 | #176 | Average 91.1% |
| Sierra Leoneans | 47.7 /100 | #177 | Average 91.1% |
| Spanish | 43.7 /100 | #178 | Average 91.1% |
| Immigrants | Chile | 43.3 /100 | #179 | Average 91.1% |
| Immigrants | Syria | 40.3 /100 | #180 | Average 91.1% |
| Guamanians/Chamorros | 39.5 /100 | #181 | Fair 91.0% |
| Immigrants | Nonimmigrants | 38.8 /100 | #182 | Fair 91.0% |
| Osage | 38.3 /100 | #183 | Fair 91.0% |
| Spaniards | 36.2 /100 | #184 | Fair 91.0% |
| Sudanese | 34.4 /100 | #185 | Fair 91.0% |
| Ethiopians | 33.9 /100 | #186 | Fair 91.0% |
| Potawatomi | 32.9 /100 | #187 | Fair 91.0% |