Spanish American Indian vs Immigrants from Burma/Myanmar GED/Equivalency
COMPARE
Spanish American Indian
Immigrants from Burma/Myanmar
GED/Equivalency
GED/Equivalency Comparison
Spanish American Indians
Immigrants from Burma/Myanmar
76.3%
GED/EQUIVALENCY
0.0/ 100
METRIC RATING
344th/ 347
METRIC RANK
83.0%
GED/EQUIVALENCY
0.2/ 100
METRIC RATING
268th/ 347
METRIC RANK
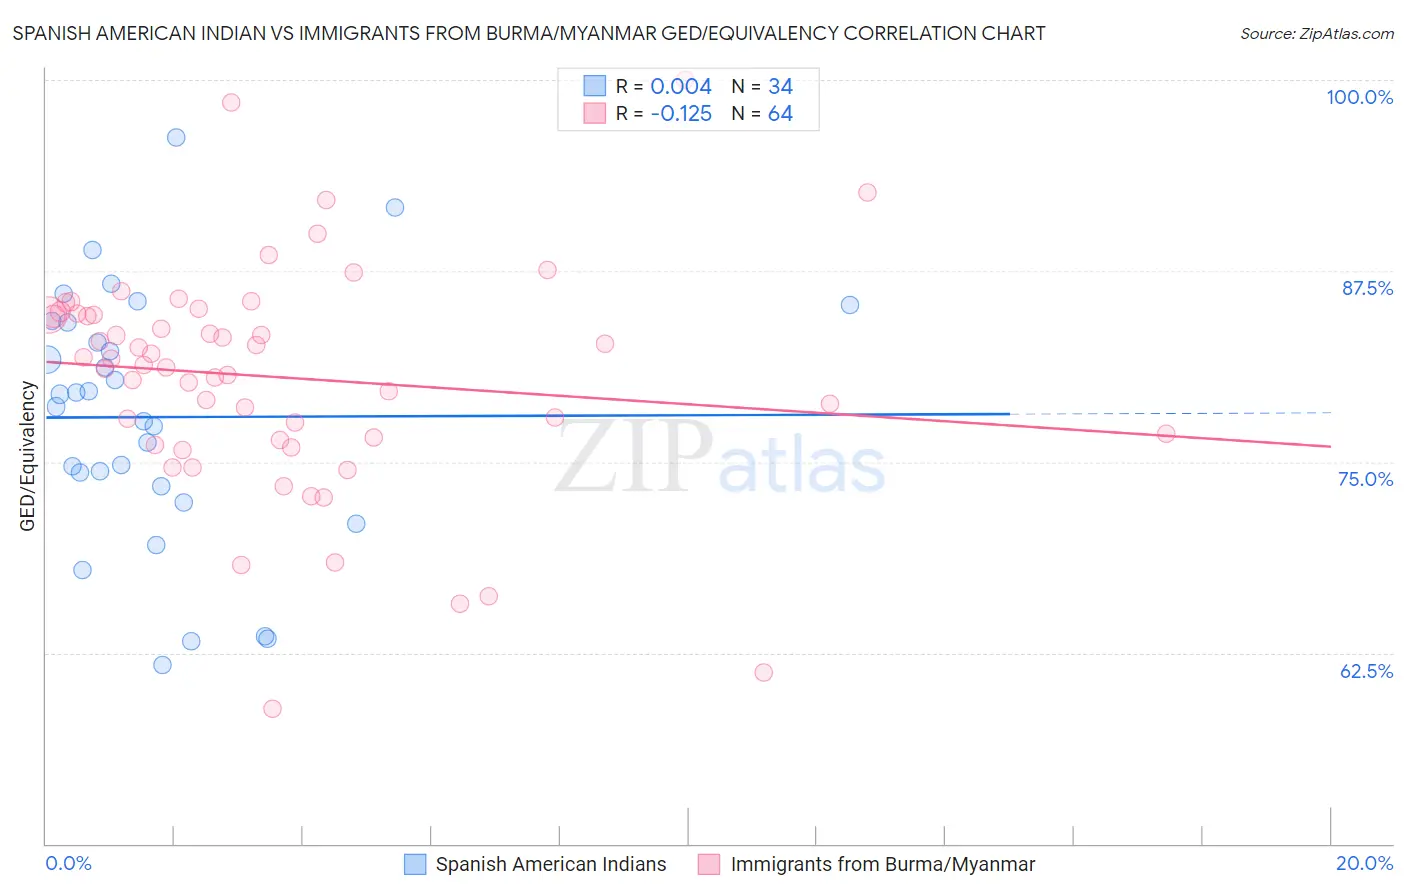
Spanish American Indian vs Immigrants from Burma/Myanmar GED/Equivalency Correlation Chart
The statistical analysis conducted on geographies consisting of 73,147,813 people shows no correlation between the proportion of Spanish American Indians and percentage of population with at least ged/equivalency education in the United States with a correlation coefficient (R) of 0.004 and weighted average of 76.3%. Similarly, the statistical analysis conducted on geographies consisting of 172,357,706 people shows a poor negative correlation between the proportion of Immigrants from Burma/Myanmar and percentage of population with at least ged/equivalency education in the United States with a correlation coefficient (R) of -0.125 and weighted average of 83.0%, a difference of 8.7%.
GED/Equivalency Correlation Summary
| Measurement | Spanish American Indian | Immigrants from Burma/Myanmar |
| Minimum | 61.7% | 58.8% |
| Maximum | 96.3% | 100.0% |
| Range | 34.6% | 41.2% |
| Mean | 77.9% | 80.5% |
| Median | 79.0% | 81.5% |
| Interquartile 25% (IQ1) | 73.4% | 76.5% |
| Interquartile 75% (IQ3) | 84.2% | 84.7% |
| Interquartile Range (IQR) | 10.8% | 8.1% |
| Standard Deviation (Sample) | 8.3% | 7.5% |
| Standard Deviation (Population) | 8.2% | 7.4% |
Similar Demographics by GED/Equivalency
Demographics Similar to Spanish American Indians by GED/Equivalency
In terms of ged/equivalency, the demographic groups most similar to Spanish American Indians are Immigrants from Central America (76.4%, a difference of 0.030%), Pima (76.4%, a difference of 0.12%), Immigrants from Mexico (75.7%, a difference of 0.89%), Mexican (77.4%, a difference of 1.4%), and Tohono O'odham (77.5%, a difference of 1.5%).
| Demographics | Rating | Rank | GED/Equivalency |
| Salvadorans | 0.0 /100 | #333 | Tragic 78.6% |
| Guatemalans | 0.0 /100 | #334 | Tragic 78.5% |
| Immigrants | Latin America | 0.0 /100 | #335 | Tragic 78.5% |
| Immigrants | Dominican Republic | 0.0 /100 | #336 | Tragic 78.0% |
| Immigrants | Yemen | 0.0 /100 | #337 | Tragic 77.9% |
| Immigrants | Guatemala | 0.0 /100 | #338 | Tragic 77.9% |
| Immigrants | El Salvador | 0.0 /100 | #339 | Tragic 77.6% |
| Tohono O'odham | 0.0 /100 | #340 | Tragic 77.5% |
| Mexicans | 0.0 /100 | #341 | Tragic 77.4% |
| Pima | 0.0 /100 | #342 | Tragic 76.4% |
| Immigrants | Central America | 0.0 /100 | #343 | Tragic 76.4% |
| Spanish American Indians | 0.0 /100 | #344 | Tragic 76.3% |
| Immigrants | Mexico | 0.0 /100 | #345 | Tragic 75.7% |
| Houma | 0.0 /100 | #346 | Tragic 75.0% |
| Yakama | 0.0 /100 | #347 | Tragic 74.5% |
Demographics Similar to Immigrants from Burma/Myanmar by GED/Equivalency
In terms of ged/equivalency, the demographic groups most similar to Immigrants from Burma/Myanmar are Trinidadian and Tobagonian (83.0%, a difference of 0.040%), Hopi (83.0%, a difference of 0.040%), West Indian (83.1%, a difference of 0.060%), Kiowa (83.1%, a difference of 0.060%), and Bangladeshi (83.1%, a difference of 0.070%).
| Demographics | Rating | Rank | GED/Equivalency |
| Inupiat | 0.2 /100 | #261 | Tragic 83.1% |
| Immigrants | Armenia | 0.2 /100 | #262 | Tragic 83.1% |
| Immigrants | Congo | 0.2 /100 | #263 | Tragic 83.1% |
| Bangladeshis | 0.2 /100 | #264 | Tragic 83.1% |
| West Indians | 0.2 /100 | #265 | Tragic 83.1% |
| Kiowa | 0.2 /100 | #266 | Tragic 83.1% |
| Trinidadians and Tobagonians | 0.2 /100 | #267 | Tragic 83.0% |
| Immigrants | Burma/Myanmar | 0.2 /100 | #268 | Tragic 83.0% |
| Hopi | 0.2 /100 | #269 | Tragic 83.0% |
| Immigrants | Jamaica | 0.2 /100 | #270 | Tragic 82.9% |
| U.S. Virgin Islanders | 0.2 /100 | #271 | Tragic 82.9% |
| Barbadians | 0.1 /100 | #272 | Tragic 82.9% |
| Pennsylvania Germans | 0.1 /100 | #273 | Tragic 82.9% |
| Immigrants | Trinidad and Tobago | 0.1 /100 | #274 | Tragic 82.8% |
| Seminole | 0.1 /100 | #275 | Tragic 82.8% |