Scotch-Irish vs Immigrants from Eastern Europe 9th Grade
COMPARE
Scotch-Irish
Immigrants from Eastern Europe
9th Grade
9th Grade Comparison
Scotch-Irish
Immigrants from Eastern Europe
96.3%
9TH GRADE
100.0/ 100
METRIC RATING
27th/ 347
METRIC RANK
95.2%
9TH GRADE
85.8/ 100
METRIC RATING
139th/ 347
METRIC RANK
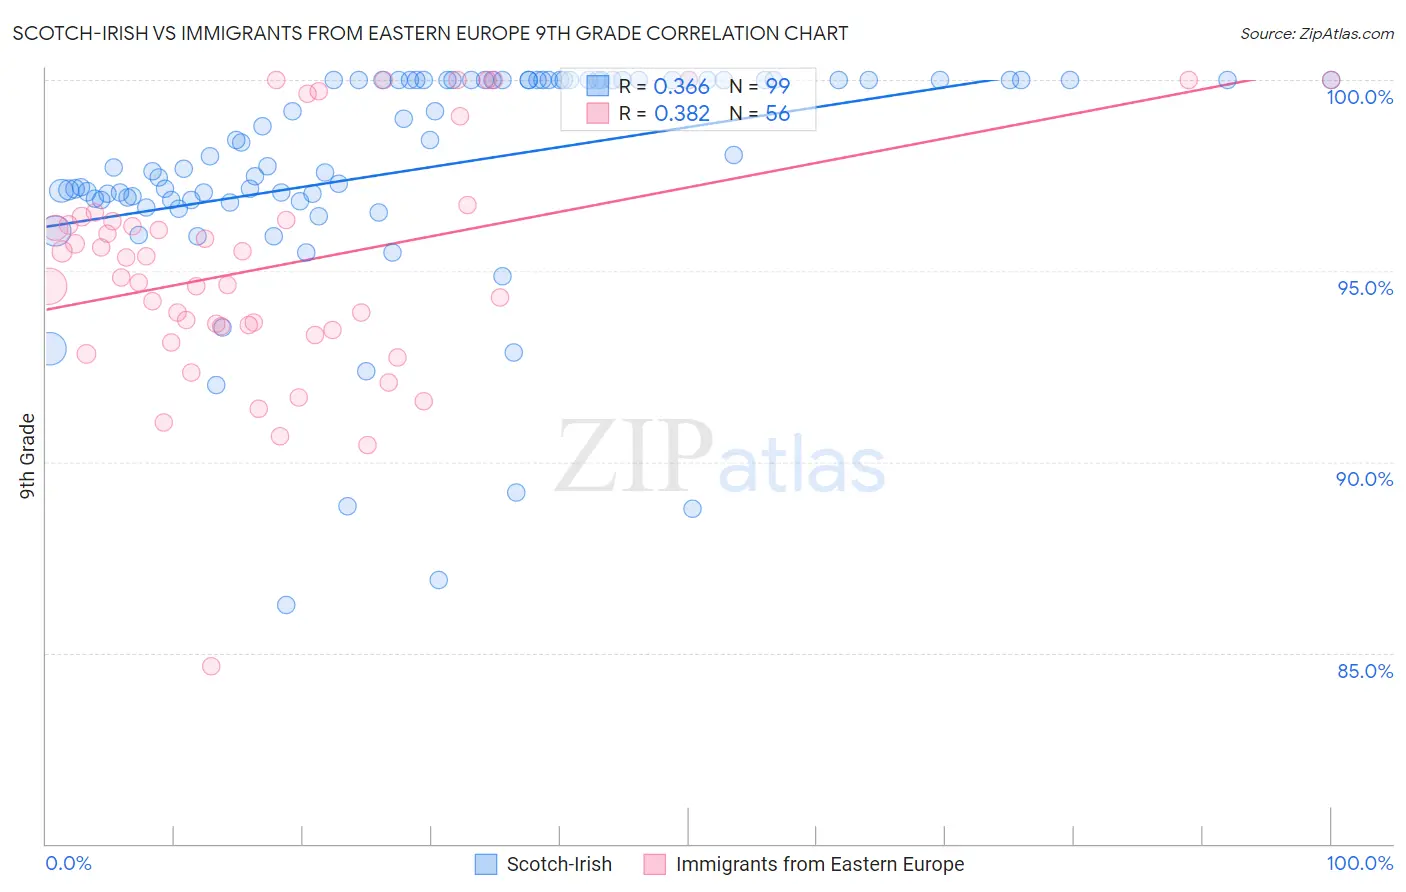
Scotch-Irish vs Immigrants from Eastern Europe 9th Grade Correlation Chart
The statistical analysis conducted on geographies consisting of 548,780,564 people shows a mild positive correlation between the proportion of Scotch-Irish and percentage of population with at least 9th grade education in the United States with a correlation coefficient (R) of 0.366 and weighted average of 96.3%. Similarly, the statistical analysis conducted on geographies consisting of 475,879,420 people shows a mild positive correlation between the proportion of Immigrants from Eastern Europe and percentage of population with at least 9th grade education in the United States with a correlation coefficient (R) of 0.382 and weighted average of 95.2%, a difference of 1.2%.
9th Grade Correlation Summary
| Measurement | Scotch-Irish | Immigrants from Eastern Europe |
| Minimum | 86.2% | 84.6% |
| Maximum | 100.0% | 100.0% |
| Range | 13.8% | 15.4% |
| Mean | 97.7% | 95.2% |
| Median | 98.0% | 95.1% |
| Interquartile 25% (IQ1) | 96.9% | 93.5% |
| Interquartile 75% (IQ3) | 100.0% | 96.4% |
| Interquartile Range (IQR) | 3.1% | 2.9% |
| Standard Deviation (Sample) | 3.0% | 3.1% |
| Standard Deviation (Population) | 3.0% | 3.1% |
Similar Demographics by 9th Grade
Demographics Similar to Scotch-Irish by 9th Grade
In terms of 9th grade, the demographic groups most similar to Scotch-Irish are Eastern European (96.3%, a difference of 0.0%), Chinese (96.3%, a difference of 0.0%), French Canadian (96.3%, a difference of 0.010%), Maltese (96.3%, a difference of 0.030%), and British (96.3%, a difference of 0.030%).
| Demographics | Rating | Rank | 9th Grade |
| Italians | 100.0 /100 | #20 | Exceptional 96.4% |
| Alaskan Athabascans | 100.0 /100 | #21 | Exceptional 96.4% |
| Europeans | 100.0 /100 | #22 | Exceptional 96.4% |
| Czechs | 100.0 /100 | #23 | Exceptional 96.4% |
| Latvians | 100.0 /100 | #24 | Exceptional 96.4% |
| French | 100.0 /100 | #25 | Exceptional 96.3% |
| French Canadians | 100.0 /100 | #26 | Exceptional 96.3% |
| Scotch-Irish | 100.0 /100 | #27 | Exceptional 96.3% |
| Eastern Europeans | 100.0 /100 | #28 | Exceptional 96.3% |
| Chinese | 100.0 /100 | #29 | Exceptional 96.3% |
| Maltese | 100.0 /100 | #30 | Exceptional 96.3% |
| British | 100.0 /100 | #31 | Exceptional 96.3% |
| Belgians | 100.0 /100 | #32 | Exceptional 96.3% |
| Luxembourgers | 100.0 /100 | #33 | Exceptional 96.3% |
| Hungarians | 100.0 /100 | #34 | Exceptional 96.2% |
Demographics Similar to Immigrants from Eastern Europe by 9th Grade
In terms of 9th grade, the demographic groups most similar to Immigrants from Eastern Europe are Immigrants from Russia (95.2%, a difference of 0.010%), Immigrants from Taiwan (95.2%, a difference of 0.010%), Immigrants from Bosnia and Herzegovina (95.2%, a difference of 0.010%), Immigrants from Greece (95.2%, a difference of 0.020%), and Spanish (95.2%, a difference of 0.020%).
| Demographics | Rating | Rank | 9th Grade |
| Immigrants | Nonimmigrants | 92.0 /100 | #132 | Exceptional 95.3% |
| Israelis | 90.4 /100 | #133 | Exceptional 95.3% |
| Immigrants | Israel | 89.6 /100 | #134 | Excellent 95.3% |
| Immigrants | Belarus | 88.9 /100 | #135 | Excellent 95.2% |
| Immigrants | Iran | 88.3 /100 | #136 | Excellent 95.2% |
| Hmong | 87.7 /100 | #137 | Excellent 95.2% |
| Immigrants | Russia | 86.6 /100 | #138 | Excellent 95.2% |
| Immigrants | Eastern Europe | 85.8 /100 | #139 | Excellent 95.2% |
| Immigrants | Taiwan | 85.3 /100 | #140 | Excellent 95.2% |
| Immigrants | Bosnia and Herzegovina | 85.2 /100 | #141 | Excellent 95.2% |
| Immigrants | Greece | 84.6 /100 | #142 | Excellent 95.2% |
| Spanish | 84.4 /100 | #143 | Excellent 95.2% |
| Yup'ik | 83.3 /100 | #144 | Excellent 95.2% |
| Pueblo | 82.2 /100 | #145 | Excellent 95.1% |
| Immigrants | Sri Lanka | 82.1 /100 | #146 | Excellent 95.1% |