Scotch-Irish vs Immigrants from Eastern Asia 9th Grade
COMPARE
Scotch-Irish
Immigrants from Eastern Asia
9th Grade
9th Grade Comparison
Scotch-Irish
Immigrants from Eastern Asia
96.3%
9TH GRADE
100.0/ 100
METRIC RATING
27th/ 347
METRIC RANK
94.6%
9TH GRADE
19.8/ 100
METRIC RATING
202nd/ 347
METRIC RANK
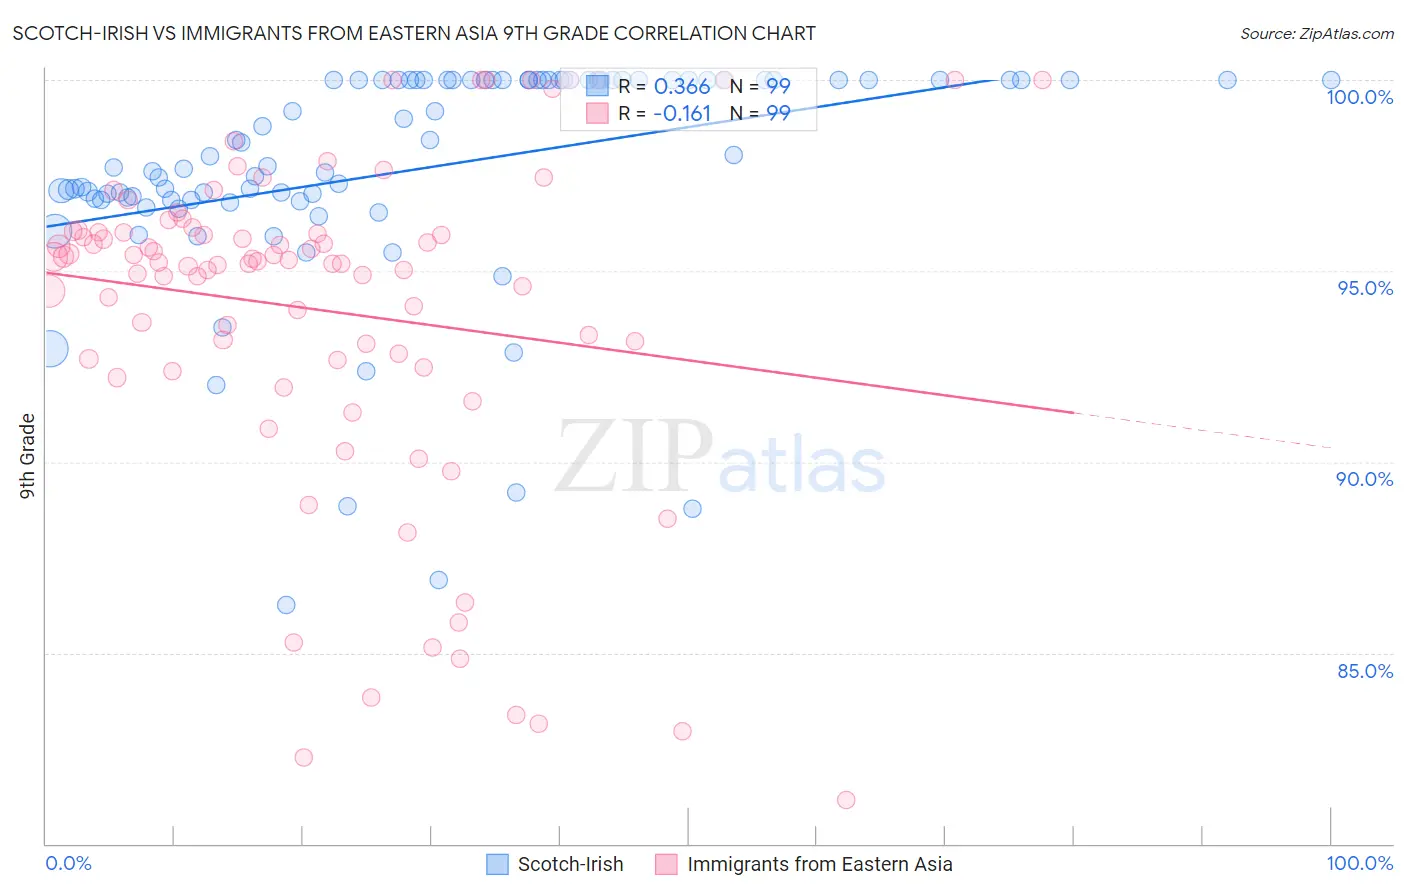
Scotch-Irish vs Immigrants from Eastern Asia 9th Grade Correlation Chart
The statistical analysis conducted on geographies consisting of 548,780,564 people shows a mild positive correlation between the proportion of Scotch-Irish and percentage of population with at least 9th grade education in the United States with a correlation coefficient (R) of 0.366 and weighted average of 96.3%. Similarly, the statistical analysis conducted on geographies consisting of 499,846,352 people shows a poor negative correlation between the proportion of Immigrants from Eastern Asia and percentage of population with at least 9th grade education in the United States with a correlation coefficient (R) of -0.161 and weighted average of 94.6%, a difference of 1.8%.
9th Grade Correlation Summary
| Measurement | Scotch-Irish | Immigrants from Eastern Asia |
| Minimum | 86.2% | 81.1% |
| Maximum | 100.0% | 100.0% |
| Range | 13.8% | 18.9% |
| Mean | 97.7% | 94.0% |
| Median | 98.0% | 95.2% |
| Interquartile 25% (IQ1) | 96.9% | 92.7% |
| Interquartile 75% (IQ3) | 100.0% | 96.0% |
| Interquartile Range (IQR) | 3.1% | 3.4% |
| Standard Deviation (Sample) | 3.0% | 4.4% |
| Standard Deviation (Population) | 3.0% | 4.4% |
Similar Demographics by 9th Grade
Demographics Similar to Scotch-Irish by 9th Grade
In terms of 9th grade, the demographic groups most similar to Scotch-Irish are Eastern European (96.3%, a difference of 0.0%), Chinese (96.3%, a difference of 0.0%), French Canadian (96.3%, a difference of 0.010%), Maltese (96.3%, a difference of 0.030%), and British (96.3%, a difference of 0.030%).
| Demographics | Rating | Rank | 9th Grade |
| Italians | 100.0 /100 | #20 | Exceptional 96.4% |
| Alaskan Athabascans | 100.0 /100 | #21 | Exceptional 96.4% |
| Europeans | 100.0 /100 | #22 | Exceptional 96.4% |
| Czechs | 100.0 /100 | #23 | Exceptional 96.4% |
| Latvians | 100.0 /100 | #24 | Exceptional 96.4% |
| French | 100.0 /100 | #25 | Exceptional 96.3% |
| French Canadians | 100.0 /100 | #26 | Exceptional 96.3% |
| Scotch-Irish | 100.0 /100 | #27 | Exceptional 96.3% |
| Eastern Europeans | 100.0 /100 | #28 | Exceptional 96.3% |
| Chinese | 100.0 /100 | #29 | Exceptional 96.3% |
| Maltese | 100.0 /100 | #30 | Exceptional 96.3% |
| British | 100.0 /100 | #31 | Exceptional 96.3% |
| Belgians | 100.0 /100 | #32 | Exceptional 96.3% |
| Luxembourgers | 100.0 /100 | #33 | Exceptional 96.3% |
| Hungarians | 100.0 /100 | #34 | Exceptional 96.2% |
Demographics Similar to Immigrants from Eastern Asia by 9th Grade
In terms of 9th grade, the demographic groups most similar to Immigrants from Eastern Asia are Immigrants from Bahamas (94.6%, a difference of 0.0%), Moroccan (94.6%, a difference of 0.0%), Laotian (94.6%, a difference of 0.010%), Immigrants from Zaire (94.6%, a difference of 0.010%), and Black/African American (94.6%, a difference of 0.010%).
| Demographics | Rating | Rank | 9th Grade |
| Marshallese | 27.9 /100 | #195 | Fair 94.7% |
| Immigrants | Lebanon | 27.2 /100 | #196 | Fair 94.7% |
| Immigrants | Micronesia | 24.7 /100 | #197 | Fair 94.7% |
| Hawaiians | 22.7 /100 | #198 | Fair 94.7% |
| Laotians | 21.0 /100 | #199 | Fair 94.6% |
| Immigrants | Zaire | 20.6 /100 | #200 | Fair 94.6% |
| Blacks/African Americans | 20.5 /100 | #201 | Fair 94.6% |
| Immigrants | Eastern Asia | 19.8 /100 | #202 | Poor 94.6% |
| Immigrants | Bahamas | 19.8 /100 | #203 | Poor 94.6% |
| Moroccans | 19.6 /100 | #204 | Poor 94.6% |
| Immigrants | Sudan | 17.6 /100 | #205 | Poor 94.6% |
| Samoans | 17.3 /100 | #206 | Poor 94.6% |
| Immigrants | Morocco | 16.3 /100 | #207 | Poor 94.6% |
| Immigrants | Pakistan | 15.5 /100 | #208 | Poor 94.6% |
| Comanche | 14.9 /100 | #209 | Poor 94.6% |