Indian (Asian) vs Immigrants from Eastern Europe 9th Grade

COMPARE

Indian (Asian)
Race
Ancestry
AfghanAfricanAlaska NativeAlaskan AthabascanAlbanianAleutAlsatianAmericanApacheArabArapahoArgentineanArmenianAssyrian/Chaldean/SyriacAustralianAustrianBahamianBangladeshiBarbadianBasqueBelgianBelizeanBermudanBhutaneseBlackfeetBolivianBrazilianBritishBritish West IndianBulgarianBurmeseCajunCambodianCanadianCape VerdeanCarpatho RusynCelticCentral AmericanCentral American IndianCherokeeCheyenneChickasawChileanChineseChippewaChoctawColombianColvilleComancheCosta RicanCreeCreekCroatianCrowCubanCypriotCzechCzechoslovakianDanishDelawareDominicanDutchDutch West IndianEastern EuropeanEcuadorianEgyptianEnglishEstonianEthiopianEuropeanFijianFilipinoFinnishFrenchFrench American IndianFrench CanadianGermanGerman RussianGhanaianGreekGuamanian/ChamorroGuatemalanGuyaneseHaitianHmongHonduranHopiHoumaHungarianIcelanderIndian (Asian)IndonesianInupiatIranianIraqiIrishIroquoisIsraeliItalianJamaicanJapaneseJordanianKenyanKiowaKoreanLaotianLatvianLebaneseLiberianLithuanianLumbeeLuxembourgerMacedonianMalaysianMalteseMarshalleseMenomineeMexicanMexican American IndianMongolianMoroccanNative HawaiianNavajoNepaleseNew ZealanderNicaraguanNigerianNorthern EuropeanNorwegianOkinawanOsageOttawaPaiutePakistaniPalestinianPanamanianParaguayanPennsylvania GermanPeruvianPimaPolishPortuguesePotawatomiPuebloPuerto RicanPuget Sound SalishRomanianRussianSalvadoranSamoanScandinavianScotch-IrishScottishSeminoleSenegaleseSerbianShoshoneSierra LeoneanSiouxSlavicSlovakSloveneSomaliSouth AfricanSouth AmericanSouth American IndianSoviet UnionSpaniardSpanishSpanish AmericanSpanish American IndianSri LankanSubsaharan AfricanSudaneseSwedishSwissSyrianTaiwaneseThaiTlingit-HaidaTohono O'OdhamTonganTrinidadian and TobagonianTsimshianTurkishU.S. Virgin IslanderUgandanUkrainianUruguayanUteVenezuelanVietnameseWelshWest IndianYakamaYaquiYugoslavianYumanYup'ikZimbabwean
Immigration
NonimmigrantsImmigrantsAfghanistanAfricaAlbaniaArgentinaArmeniaAsiaAustraliaAustriaBahamasBangladeshBarbadosBelarusBelgiumBelizeBoliviaBosnia and HerzegovinaBrazilBulgariaBurma/MyanmarCabo VerdeCambodiaCameroonCanadaCaribbeanCentral AmericaChileChinaColombiaCongoCosta RicaCroatiaCubaCzechoslovakiaDenmarkDominicaDominican RepublicEastern AfricaEastern AsiaEcuadorEgyptEl SalvadorEnglandEritreaEthiopiaEuropeFijiFranceGermanyGhanaGreeceGrenadaGuatemalaGuyanaHaitiHondurasHong KongHungaryIndiaIndonesiaIranIraqIrelandIsraelItalyJamaicaJapanJordanKazakhstanKenyaKoreaKuwaitLaosLatin AmericaLatviaLebanonLiberiaLithuaniaMalaysiaMexicoMicronesiaMiddle AfricaMoldovaMoroccoNepalNetherlandsNicaraguaNigeriaNorth AmericaNorth MacedoniaNorthern AfricaNorthern EuropeNorwayOceaniaPakistanPanamaPeruPhilippinesPolandPortugalRomaniaRussiaSaudi ArabiaScotlandSenegalSerbiaSierra LeoneSingaporeSomaliaSouth AfricaSouth AmericaSouth Central AsiaSouth Eastern AsiaSouthern EuropeSpainSri LankaSt. Vincent and the GrenadinesSudanSwedenSwitzerlandSyriaTaiwanThailandTrinidad and TobagoTurkeyUgandaUkraineUruguayUzbekistanVenezuelaVietnamWest IndiesWestern AfricaWestern AsiaWestern EuropeYemenZaireZimbabweAzores
Immigrants from Eastern Europe
Race
Ancestry
AfghanAfricanAlaska NativeAlaskan AthabascanAlbanianAleutAlsatianAmericanApacheArabArapahoArgentineanArmenianAssyrian/Chaldean/SyriacAustralianAustrianBahamianBangladeshiBarbadianBasqueBelgianBelizeanBermudanBhutaneseBlackfeetBolivianBrazilianBritishBritish West IndianBulgarianBurmeseCajunCambodianCanadianCape VerdeanCarpatho RusynCelticCentral AmericanCentral American IndianCherokeeCheyenneChickasawChileanChineseChippewaChoctawColombianColvilleComancheCosta RicanCreeCreekCroatianCrowCubanCypriotCzechCzechoslovakianDanishDelawareDominicanDutchDutch West IndianEastern EuropeanEcuadorianEgyptianEnglishEstonianEthiopianEuropeanFijianFilipinoFinnishFrenchFrench American IndianFrench CanadianGermanGerman RussianGhanaianGreekGuamanian/ChamorroGuatemalanGuyaneseHaitianHmongHonduranHopiHoumaHungarianIcelanderIndonesianInupiatIranianIraqiIrishIroquoisIsraeliItalianJamaicanJapaneseJordanianKenyanKiowaKoreanLaotianLatvianLebaneseLiberianLithuanianLumbeeLuxembourgerMacedonianMalaysianMalteseMarshalleseMenomineeMexicanMexican American IndianMongolianMoroccanNative HawaiianNavajoNepaleseNew ZealanderNicaraguanNigerianNorthern EuropeanNorwegianOkinawanOsageOttawaPaiutePakistaniPalestinianPanamanianParaguayanPennsylvania GermanPeruvianPimaPolishPortuguesePotawatomiPuebloPuerto RicanPuget Sound SalishRomanianRussianSalvadoranSamoanScandinavianScotch-IrishScottishSeminoleSenegaleseSerbianShoshoneSierra LeoneanSiouxSlavicSlovakSloveneSomaliSouth AfricanSouth AmericanSouth American IndianSoviet UnionSpaniardSpanishSpanish AmericanSpanish American IndianSri LankanSubsaharan AfricanSudaneseSwedishSwissSyrianTaiwaneseThaiTlingit-HaidaTohono O'OdhamTonganTrinidadian and TobagonianTsimshianTurkishU.S. Virgin IslanderUgandanUkrainianUruguayanUteVenezuelanVietnameseWelshWest IndianYakamaYaquiYugoslavianYumanYup'ikZimbabwean
Immigration
NonimmigrantsImmigrantsAfghanistanAfricaAlbaniaArgentinaArmeniaAsiaAustraliaAustriaBahamasBangladeshBarbadosBelarusBelgiumBelizeBoliviaBosnia and HerzegovinaBrazilBulgariaBurma/MyanmarCabo VerdeCambodiaCameroonCanadaCaribbeanCentral AmericaChileChinaColombiaCongoCosta RicaCroatiaCubaCzechoslovakiaDenmarkDominicaDominican RepublicEastern AfricaEastern AsiaEastern EuropeEcuadorEgyptEl SalvadorEnglandEritreaEthiopiaEuropeFijiFranceGermanyGhanaGreeceGrenadaGuatemalaGuyanaHaitiHondurasHong KongHungaryIndiaIndonesiaIranIraqIrelandIsraelItalyJamaicaJapanJordanKazakhstanKenyaKoreaKuwaitLaosLatin AmericaLatviaLebanonLiberiaLithuaniaMalaysiaMexicoMicronesiaMiddle AfricaMoldovaMoroccoNepalNetherlandsNicaraguaNigeriaNorth AmericaNorth MacedoniaNorthern AfricaNorthern EuropeNorwayOceaniaPakistanPanamaPeruPhilippinesPolandPortugalRomaniaRussiaSaudi ArabiaScotlandSenegalSerbiaSierra LeoneSingaporeSomaliaSouth AfricaSouth AmericaSouth Central AsiaSouth Eastern AsiaSouthern EuropeSpainSri LankaSt. Vincent and the GrenadinesSudanSwedenSwitzerlandSyriaTaiwanThailandTrinidad and TobagoTurkeyUgandaUkraineUruguayUzbekistanVenezuelaVietnamWest IndiesWestern AfricaWestern AsiaWestern EuropeYemenZaireZimbabweAzores
9th Grade
Income
Poverty
Unemployment
Labor Participation
Family Structure
Vehicle Availability
Education Level
Disability

9th Grade Comparison

Indians (Asian)

Immigrants from Eastern Europe

Tragic
Excellent
94.5%
9TH GRADE
8.6/ 100
METRIC RATING
220th/ 347
METRIC RANK
95.2%
9TH GRADE
85.8/ 100
METRIC RATING
139th/ 347
METRIC RANK

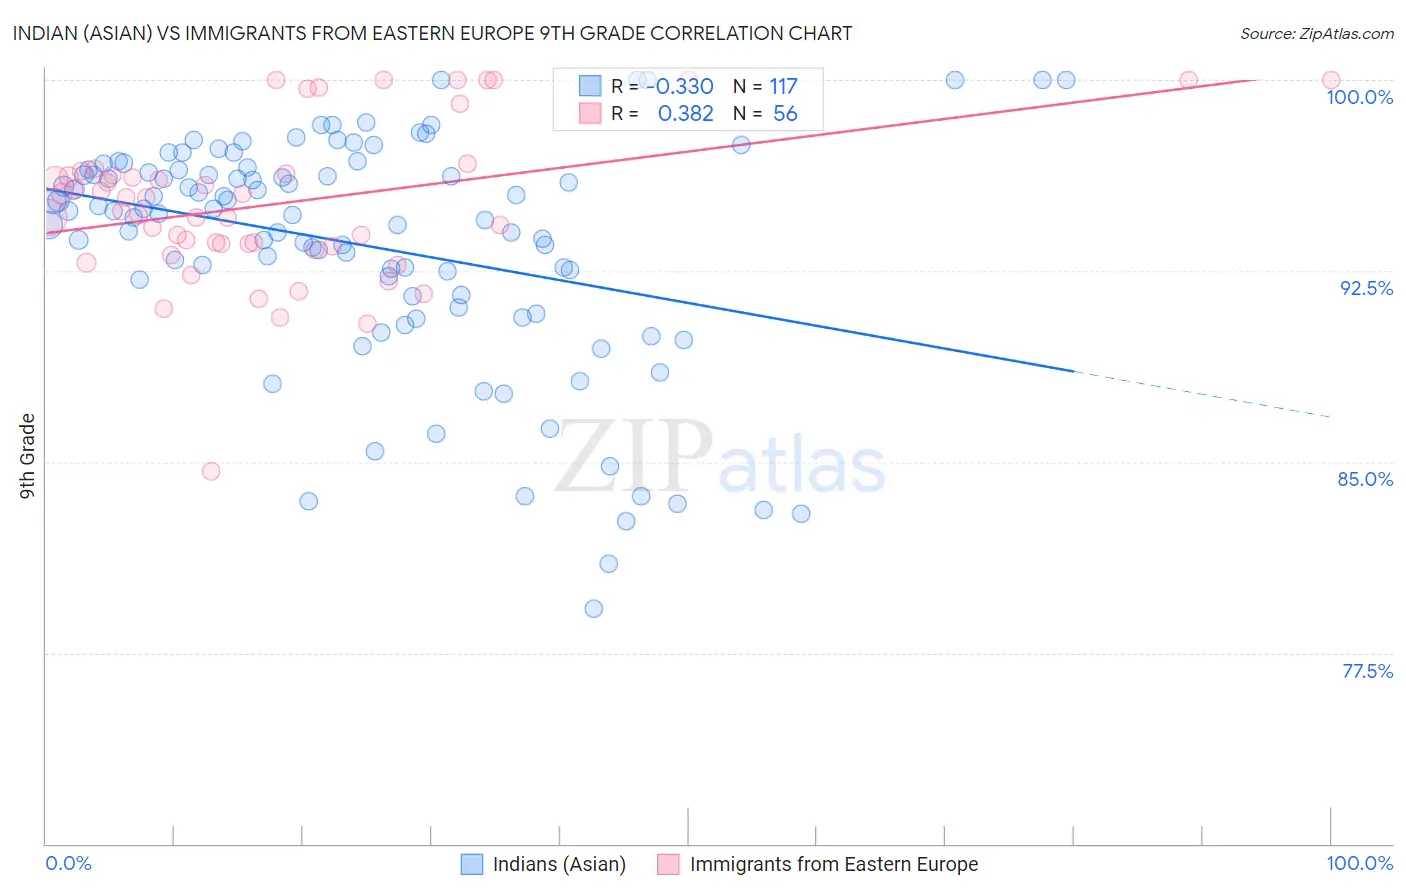
Indian (Asian) vs Immigrants from Eastern Europe 9th Grade Correlation Chart

The statistical analysis conducted on geographies consisting of 495,348,182 people shows a mild negative correlation between the proportion of Indians (Asian) and percentage of population with at least 9th grade education in the United States with a correlation coefficient (R) of -0.330 and weighted average of 94.5%. Similarly, the statistical analysis conducted on geographies consisting of 475,879,420 people shows a mild positive correlation between the proportion of Immigrants from Eastern Europe and percentage of population with at least 9th grade education in the United States with a correlation coefficient (R) of 0.382 and weighted average of 95.2%, a difference of 0.77%.
Indian (Asian) vs Immigrants from Eastern Europe 9th Grade

9th Grade Correlation Summary

MeasurementIndian (Asian)Immigrants from Eastern Europe
Minimum79.3%84.6%
Maximum100.0%100.0%
Range20.7%15.4%
Mean93.5%95.2%
Median94.8%95.1%
Interquartile 25% (IQ1)91.5%93.5%
Interquartile 75% (IQ3)96.5%96.4%
Interquartile Range (IQR)5.0%2.9%
Standard Deviation (Sample)4.5%3.1%
Standard Deviation (Population)4.5%3.1%

Similar Demographics by 9th Grade

Demographics Similar to Indians (Asian) by 9th Grade

In terms of 9th grade, the demographic groups most similar to Indians (Asian) are Portuguese (94.5%, a difference of 0.010%), African (94.5%, a difference of 0.010%), Immigrants from Eastern Africa (94.5%, a difference of 0.010%), Immigrants from Asia (94.4%, a difference of 0.020%), and Asian (94.5%, a difference of 0.030%).
DemographicsRating | Rank9th Grade
Immigrants | Oceania
12.1
/100
|
#213
Poor
94.5%
Immigrants | Liberia
11.8
/100
|
#214
Poor
94.5%
Immigrants | Syria
11.0
/100
|
#215
Poor
94.5%
Immigrants | Western Asia
10.7
/100
|
#216
Poor
94.5%
Asians
9.9
/100
|
#217
Tragic
94.5%
Portuguese
9.2
/100
|
#218
Tragic
94.5%
Africans
9.0
/100
|
#219
Tragic
94.5%
Indians (Asian)
8.6
/100
|
#220
Tragic
94.5%
Immigrants | Eastern Africa
8.2
/100
|
#221
Tragic
94.5%
Immigrants | Asia
7.7
/100
|
#222
Tragic
94.4%
Bahamians
7.0
/100
|
#223
Tragic
94.4%
Tongans
6.0
/100
|
#224
Tragic
94.4%
Ethiopians
5.4
/100
|
#225
Tragic
94.4%
Sub-Saharan Africans
5.4
/100
|
#226
Tragic
94.4%
Immigrants | Sierra Leone
4.8
/100
|
#227
Tragic
94.4%

Demographics Similar to Immigrants from Eastern Europe by 9th Grade

In terms of 9th grade, the demographic groups most similar to Immigrants from Eastern Europe are Immigrants from Russia (95.2%, a difference of 0.010%), Immigrants from Taiwan (95.2%, a difference of 0.010%), Immigrants from Bosnia and Herzegovina (95.2%, a difference of 0.010%), Immigrants from Greece (95.2%, a difference of 0.020%), and Spanish (95.2%, a difference of 0.020%).
DemographicsRating | Rank9th Grade
Immigrants | Nonimmigrants
92.0
/100
|
#132
Exceptional
95.3%
Israelis
90.4
/100
|
#133
Exceptional
95.3%
Immigrants | Israel
89.6
/100
|
#134
Excellent
95.3%
Immigrants | Belarus
88.9
/100
|
#135
Excellent
95.2%
Immigrants | Iran
88.3
/100
|
#136
Excellent
95.2%
Hmong
87.7
/100
|
#137
Excellent
95.2%
Immigrants | Russia
86.6
/100
|
#138
Excellent
95.2%
Immigrants | Eastern Europe
85.8
/100
|
#139
Excellent
95.2%
Immigrants | Taiwan
85.3
/100
|
#140
Excellent
95.2%
Immigrants | Bosnia and Herzegovina
85.2
/100
|
#141
Excellent
95.2%
Immigrants | Greece
84.6
/100
|
#142
Excellent
95.2%
Spanish
84.4
/100
|
#143
Excellent
95.2%
Yup'ik
83.3
/100
|
#144
Excellent
95.2%
Pueblo
82.2
/100
|
#145
Excellent
95.1%
Immigrants | Sri Lanka
82.1
/100
|
#146
Excellent
95.1%