Scotch-Irish vs Honduran 9th Grade
COMPARE
Scotch-Irish
Honduran
9th Grade
9th Grade Comparison
Scotch-Irish
Hondurans
96.3%
9TH GRADE
100.0/ 100
METRIC RATING
27th/ 347
METRIC RANK
91.0%
9TH GRADE
0.0/ 100
METRIC RATING
329th/ 347
METRIC RANK
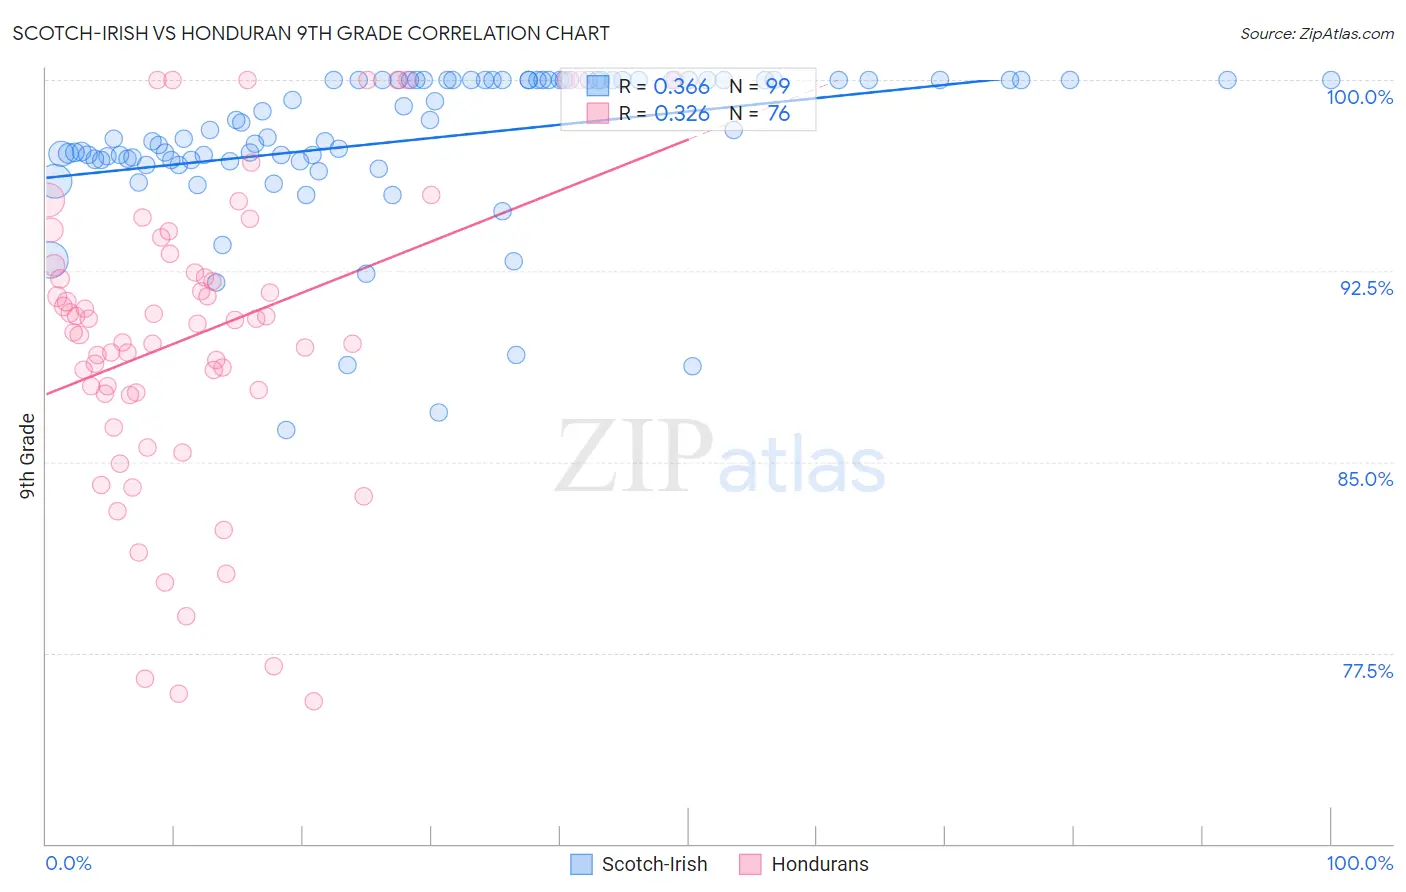
Scotch-Irish vs Honduran 9th Grade Correlation Chart
The statistical analysis conducted on geographies consisting of 548,780,564 people shows a mild positive correlation between the proportion of Scotch-Irish and percentage of population with at least 9th grade education in the United States with a correlation coefficient (R) of 0.366 and weighted average of 96.3%. Similarly, the statistical analysis conducted on geographies consisting of 357,784,803 people shows a mild positive correlation between the proportion of Hondurans and percentage of population with at least 9th grade education in the United States with a correlation coefficient (R) of 0.326 and weighted average of 91.0%, a difference of 5.8%.
9th Grade Correlation Summary
| Measurement | Scotch-Irish | Honduran |
| Minimum | 86.2% | 75.6% |
| Maximum | 100.0% | 100.0% |
| Range | 13.8% | 24.4% |
| Mean | 97.7% | 90.0% |
| Median | 98.0% | 90.5% |
| Interquartile 25% (IQ1) | 96.9% | 87.7% |
| Interquartile 75% (IQ3) | 100.0% | 92.9% |
| Interquartile Range (IQR) | 3.1% | 5.2% |
| Standard Deviation (Sample) | 3.0% | 5.9% |
| Standard Deviation (Population) | 3.0% | 5.9% |
Similar Demographics by 9th Grade
Demographics Similar to Scotch-Irish by 9th Grade
In terms of 9th grade, the demographic groups most similar to Scotch-Irish are Eastern European (96.3%, a difference of 0.0%), Chinese (96.3%, a difference of 0.0%), French Canadian (96.3%, a difference of 0.010%), Maltese (96.3%, a difference of 0.030%), and British (96.3%, a difference of 0.030%).
| Demographics | Rating | Rank | 9th Grade |
| Italians | 100.0 /100 | #20 | Exceptional 96.4% |
| Alaskan Athabascans | 100.0 /100 | #21 | Exceptional 96.4% |
| Europeans | 100.0 /100 | #22 | Exceptional 96.4% |
| Czechs | 100.0 /100 | #23 | Exceptional 96.4% |
| Latvians | 100.0 /100 | #24 | Exceptional 96.4% |
| French | 100.0 /100 | #25 | Exceptional 96.3% |
| French Canadians | 100.0 /100 | #26 | Exceptional 96.3% |
| Scotch-Irish | 100.0 /100 | #27 | Exceptional 96.3% |
| Eastern Europeans | 100.0 /100 | #28 | Exceptional 96.3% |
| Chinese | 100.0 /100 | #29 | Exceptional 96.3% |
| Maltese | 100.0 /100 | #30 | Exceptional 96.3% |
| British | 100.0 /100 | #31 | Exceptional 96.3% |
| Belgians | 100.0 /100 | #32 | Exceptional 96.3% |
| Luxembourgers | 100.0 /100 | #33 | Exceptional 96.3% |
| Hungarians | 100.0 /100 | #34 | Exceptional 96.2% |
Demographics Similar to Hondurans by 9th Grade
In terms of 9th grade, the demographic groups most similar to Hondurans are Dominican (91.1%, a difference of 0.030%), Immigrants from Cabo Verde (90.9%, a difference of 0.12%), Mexican American Indian (90.9%, a difference of 0.15%), Hispanic or Latino (90.9%, a difference of 0.17%), and Immigrants from Yemen (90.8%, a difference of 0.26%).
| Demographics | Rating | Rank | 9th Grade |
| Belizeans | 0.0 /100 | #322 | Tragic 91.8% |
| Puerto Ricans | 0.0 /100 | #323 | Tragic 91.8% |
| Immigrants | Belize | 0.0 /100 | #324 | Tragic 91.8% |
| Central American Indians | 0.0 /100 | #325 | Tragic 91.5% |
| Immigrants | Armenia | 0.0 /100 | #326 | Tragic 91.4% |
| Immigrants | Nicaragua | 0.0 /100 | #327 | Tragic 91.3% |
| Dominicans | 0.0 /100 | #328 | Tragic 91.1% |
| Hondurans | 0.0 /100 | #329 | Tragic 91.0% |
| Immigrants | Cabo Verde | 0.0 /100 | #330 | Tragic 90.9% |
| Mexican American Indians | 0.0 /100 | #331 | Tragic 90.9% |
| Hispanics or Latinos | 0.0 /100 | #332 | Tragic 90.9% |
| Immigrants | Yemen | 0.0 /100 | #333 | Tragic 90.8% |
| Immigrants | Azores | 0.0 /100 | #334 | Tragic 90.8% |
| Immigrants | Honduras | 0.0 /100 | #335 | Tragic 90.6% |
| Immigrants | Dominican Republic | 0.0 /100 | #336 | Tragic 90.5% |