Trinidadian and Tobagonian vs Honduran 9th Grade
COMPARE
Trinidadian and Tobagonian
Honduran
9th Grade
9th Grade Comparison
Trinidadians and Tobagonians
Hondurans
93.7%
9TH GRADE
0.1/ 100
METRIC RATING
279th/ 347
METRIC RANK
91.0%
9TH GRADE
0.0/ 100
METRIC RATING
329th/ 347
METRIC RANK
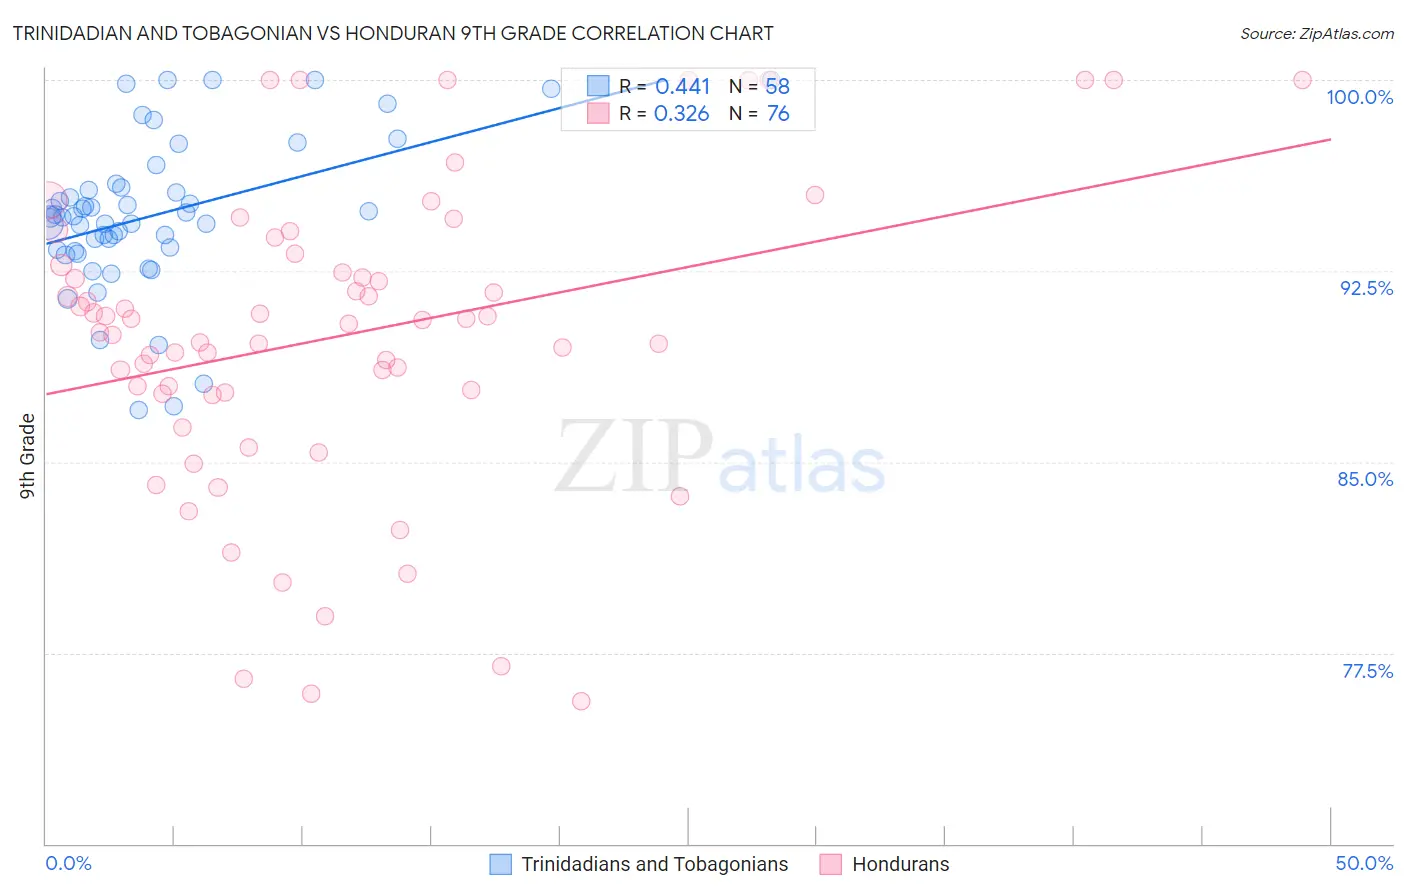
Trinidadian and Tobagonian vs Honduran 9th Grade Correlation Chart
The statistical analysis conducted on geographies consisting of 219,881,170 people shows a moderate positive correlation between the proportion of Trinidadians and Tobagonians and percentage of population with at least 9th grade education in the United States with a correlation coefficient (R) of 0.441 and weighted average of 93.7%. Similarly, the statistical analysis conducted on geographies consisting of 357,784,803 people shows a mild positive correlation between the proportion of Hondurans and percentage of population with at least 9th grade education in the United States with a correlation coefficient (R) of 0.326 and weighted average of 91.0%, a difference of 2.9%.
9th Grade Correlation Summary
| Measurement | Trinidadian and Tobagonian | Honduran |
| Minimum | 87.0% | 75.6% |
| Maximum | 100.0% | 100.0% |
| Range | 13.0% | 24.4% |
| Mean | 94.7% | 90.0% |
| Median | 94.6% | 90.5% |
| Interquartile 25% (IQ1) | 93.3% | 87.7% |
| Interquartile 75% (IQ3) | 95.8% | 92.9% |
| Interquartile Range (IQR) | 2.5% | 5.2% |
| Standard Deviation (Sample) | 3.0% | 5.9% |
| Standard Deviation (Population) | 3.0% | 5.9% |
Similar Demographics by 9th Grade
Demographics Similar to Trinidadians and Tobagonians by 9th Grade
In terms of 9th grade, the demographic groups most similar to Trinidadians and Tobagonians are Immigrants from Philippines (93.7%, a difference of 0.060%), Immigrants from Eritrea (93.7%, a difference of 0.060%), West Indian (93.7%, a difference of 0.070%), Immigrants from Colombia (93.8%, a difference of 0.080%), and Taiwanese (93.6%, a difference of 0.080%).
| Demographics | Rating | Rank | 9th Grade |
| Immigrants | Western Africa | 0.2 /100 | #272 | Tragic 93.8% |
| Immigrants | South America | 0.2 /100 | #273 | Tragic 93.8% |
| Peruvians | 0.2 /100 | #274 | Tragic 93.8% |
| Immigrants | Colombia | 0.2 /100 | #275 | Tragic 93.8% |
| West Indians | 0.2 /100 | #276 | Tragic 93.7% |
| Immigrants | Philippines | 0.1 /100 | #277 | Tragic 93.7% |
| Immigrants | Eritrea | 0.1 /100 | #278 | Tragic 93.7% |
| Trinidadians and Tobagonians | 0.1 /100 | #279 | Tragic 93.7% |
| Taiwanese | 0.1 /100 | #280 | Tragic 93.6% |
| Immigrants | Trinidad and Tobago | 0.1 /100 | #281 | Tragic 93.6% |
| Malaysians | 0.0 /100 | #282 | Tragic 93.5% |
| Barbadians | 0.0 /100 | #283 | Tragic 93.5% |
| Bangladeshis | 0.0 /100 | #284 | Tragic 93.4% |
| Immigrants | Peru | 0.0 /100 | #285 | Tragic 93.4% |
| Immigrants | Barbados | 0.0 /100 | #286 | Tragic 93.4% |
Demographics Similar to Hondurans by 9th Grade
In terms of 9th grade, the demographic groups most similar to Hondurans are Dominican (91.1%, a difference of 0.030%), Immigrants from Cabo Verde (90.9%, a difference of 0.12%), Mexican American Indian (90.9%, a difference of 0.15%), Hispanic or Latino (90.9%, a difference of 0.17%), and Immigrants from Yemen (90.8%, a difference of 0.26%).
| Demographics | Rating | Rank | 9th Grade |
| Belizeans | 0.0 /100 | #322 | Tragic 91.8% |
| Puerto Ricans | 0.0 /100 | #323 | Tragic 91.8% |
| Immigrants | Belize | 0.0 /100 | #324 | Tragic 91.8% |
| Central American Indians | 0.0 /100 | #325 | Tragic 91.5% |
| Immigrants | Armenia | 0.0 /100 | #326 | Tragic 91.4% |
| Immigrants | Nicaragua | 0.0 /100 | #327 | Tragic 91.3% |
| Dominicans | 0.0 /100 | #328 | Tragic 91.1% |
| Hondurans | 0.0 /100 | #329 | Tragic 91.0% |
| Immigrants | Cabo Verde | 0.0 /100 | #330 | Tragic 90.9% |
| Mexican American Indians | 0.0 /100 | #331 | Tragic 90.9% |
| Hispanics or Latinos | 0.0 /100 | #332 | Tragic 90.9% |
| Immigrants | Yemen | 0.0 /100 | #333 | Tragic 90.8% |
| Immigrants | Azores | 0.0 /100 | #334 | Tragic 90.8% |
| Immigrants | Honduras | 0.0 /100 | #335 | Tragic 90.6% |
| Immigrants | Dominican Republic | 0.0 /100 | #336 | Tragic 90.5% |