Pima vs Kiowa Associate's Degree
COMPARE
Pima
Kiowa
Associate's Degree
Associate's Degree Comparison
Pima
Kiowa
30.2%
ASSOCIATE'S DEGREE
0.0/ 100
METRIC RATING
345th/ 347
METRIC RANK
36.5%
ASSOCIATE'S DEGREE
0.0/ 100
METRIC RATING
326th/ 347
METRIC RANK
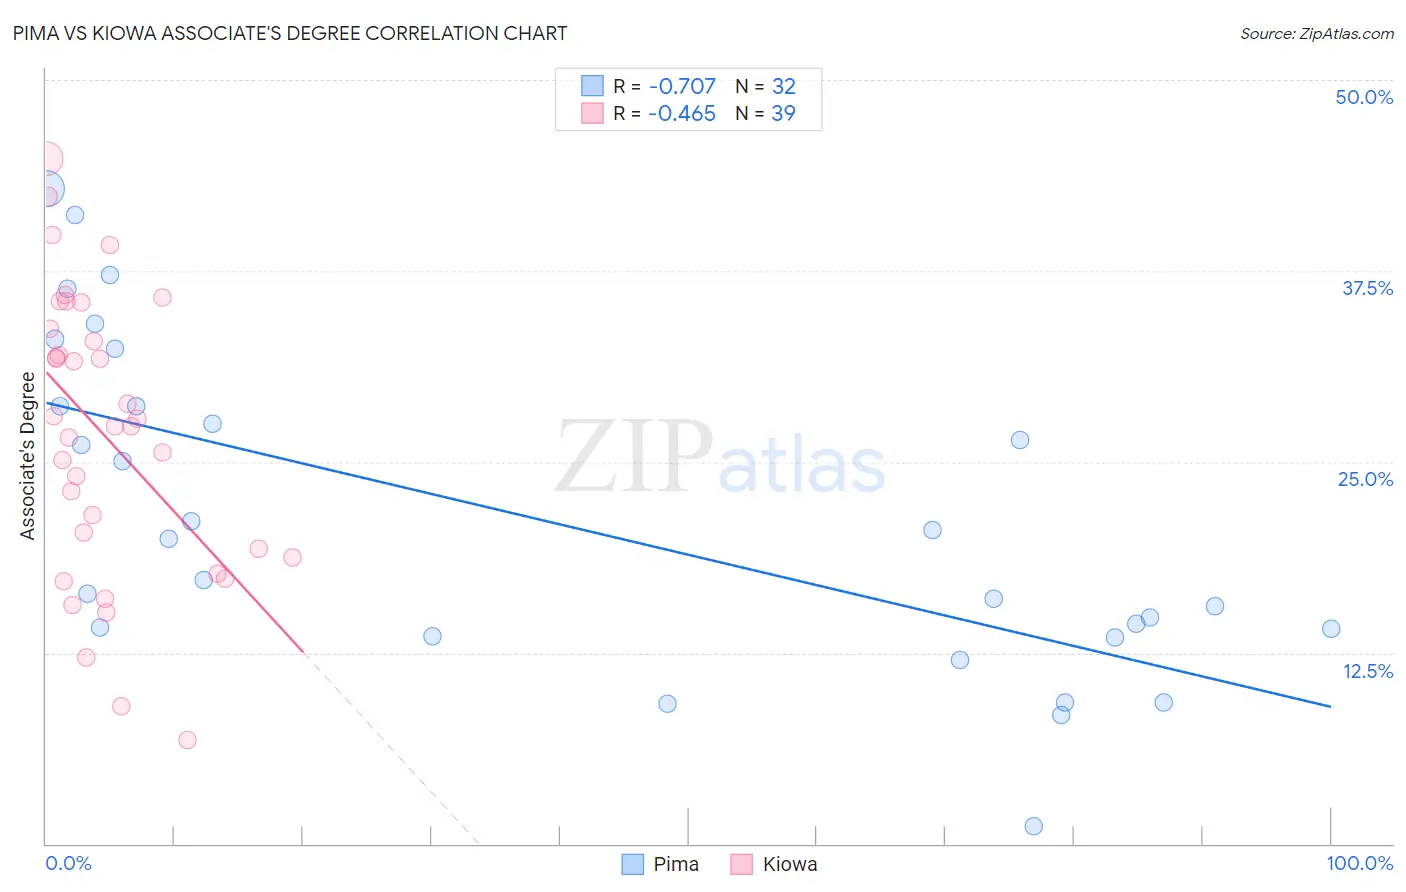
Pima vs Kiowa Associate's Degree Correlation Chart
The statistical analysis conducted on geographies consisting of 61,552,411 people shows a strong negative correlation between the proportion of Pima and percentage of population with at least associate's degree education in the United States with a correlation coefficient (R) of -0.707 and weighted average of 30.2%. Similarly, the statistical analysis conducted on geographies consisting of 56,101,363 people shows a moderate negative correlation between the proportion of Kiowa and percentage of population with at least associate's degree education in the United States with a correlation coefficient (R) of -0.465 and weighted average of 36.5%, a difference of 20.7%.
Associate's Degree Correlation Summary
| Measurement | Pima | Kiowa |
| Minimum | 1.2% | 6.8% |
| Maximum | 42.9% | 44.8% |
| Range | 41.8% | 38.0% |
| Mean | 21.3% | 26.7% |
| Median | 18.6% | 27.3% |
| Interquartile 25% (IQ1) | 13.8% | 18.7% |
| Interquartile 75% (IQ3) | 28.6% | 33.7% |
| Interquartile Range (IQR) | 14.8% | 15.0% |
| Standard Deviation (Sample) | 10.6% | 9.3% |
| Standard Deviation (Population) | 10.4% | 9.2% |
Demographics Similar to Pima and Kiowa by Associate's Degree
In terms of associate's degree, the demographic groups most similar to Pima are Yuman (31.3%, a difference of 3.4%), Tohono O'odham (31.8%, a difference of 5.1%), Yakama (32.3%, a difference of 6.9%), Inupiat (32.6%, a difference of 7.7%), and Navajo (32.6%, a difference of 7.8%). Similarly, the demographic groups most similar to Kiowa are Dutch West Indian (36.5%, a difference of 0.020%), Alaskan Athabascan (36.5%, a difference of 0.030%), Paiute (36.4%, a difference of 0.32%), Menominee (36.7%, a difference of 0.56%), and Apache (36.2%, a difference of 0.63%).
| Demographics | Rating | Rank | Associate's Degree |
| Menominee | 0.0 /100 | #325 | Tragic 36.7% |
| Kiowa | 0.0 /100 | #326 | Tragic 36.5% |
| Dutch West Indians | 0.0 /100 | #327 | Tragic 36.5% |
| Alaskan Athabascans | 0.0 /100 | #328 | Tragic 36.5% |
| Paiute | 0.0 /100 | #329 | Tragic 36.4% |
| Apache | 0.0 /100 | #330 | Tragic 36.2% |
| Immigrants | Azores | 0.0 /100 | #331 | Tragic 35.6% |
| Immigrants | Central America | 0.0 /100 | #332 | Tragic 35.0% |
| Mexicans | 0.0 /100 | #333 | Tragic 35.0% |
| Natives/Alaskans | 0.0 /100 | #334 | Tragic 34.9% |
| Spanish American Indians | 0.0 /100 | #335 | Tragic 34.9% |
| Hopi | 0.0 /100 | #336 | Tragic 34.6% |
| Lumbee | 0.0 /100 | #337 | Tragic 34.1% |
| Pueblo | 0.0 /100 | #338 | Tragic 34.0% |
| Immigrants | Mexico | 0.0 /100 | #339 | Tragic 33.7% |
| Navajo | 0.0 /100 | #340 | Tragic 32.6% |
| Inupiat | 0.0 /100 | #341 | Tragic 32.6% |
| Yakama | 0.0 /100 | #342 | Tragic 32.3% |
| Tohono O'odham | 0.0 /100 | #343 | Tragic 31.8% |
| Yuman | 0.0 /100 | #344 | Tragic 31.3% |
| Pima | 0.0 /100 | #345 | Tragic 30.2% |