Pima vs Brazilian Associate's Degree
COMPARE
Pima
Brazilian
Associate's Degree
Associate's Degree Comparison
Pima
Brazilians
30.2%
ASSOCIATE'S DEGREE
0.0/ 100
METRIC RATING
345th/ 347
METRIC RANK
48.7%
ASSOCIATE'S DEGREE
93.7/ 100
METRIC RATING
123rd/ 347
METRIC RANK
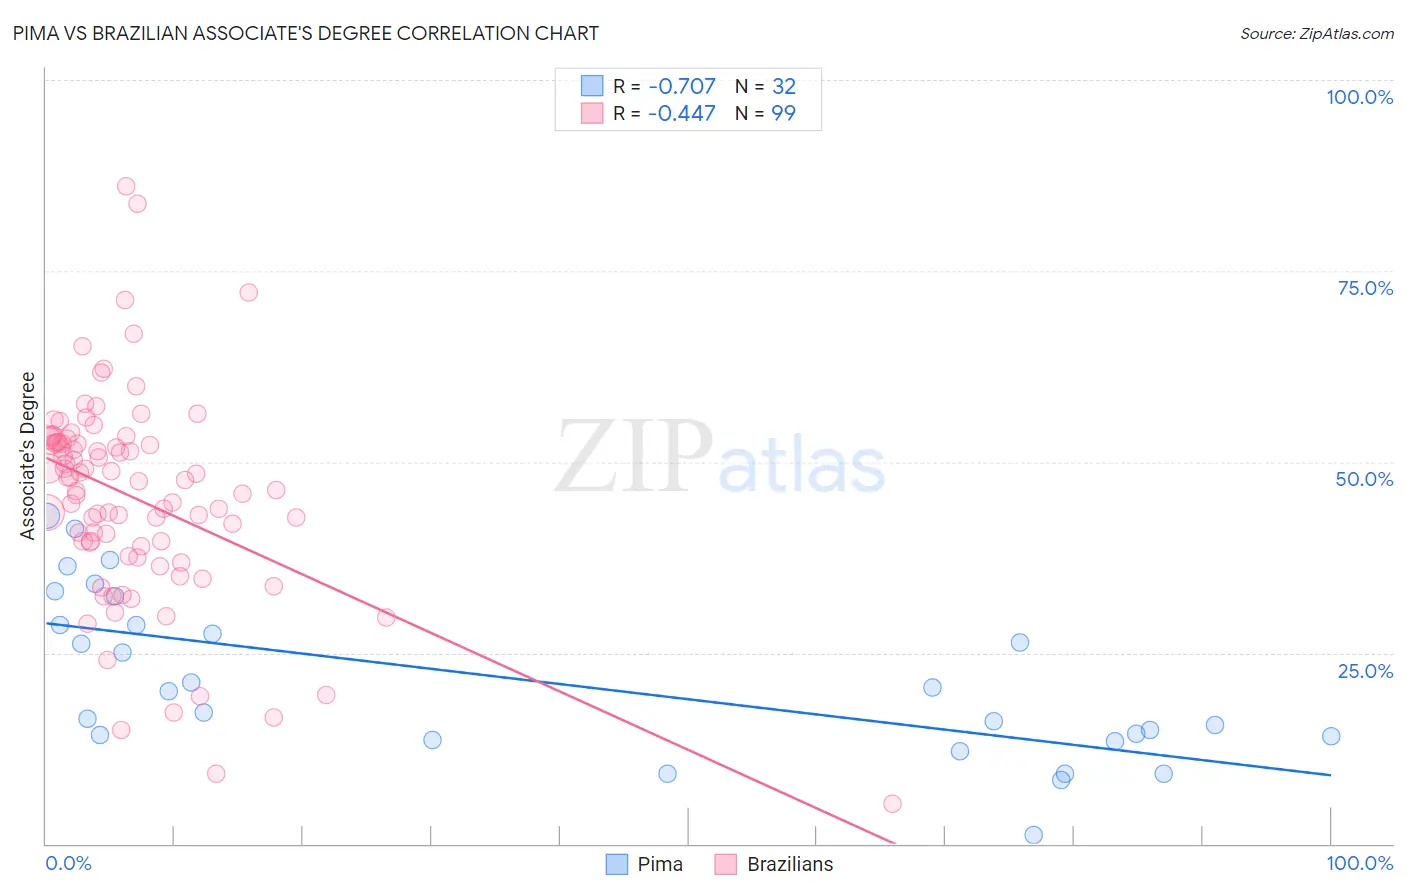
Pima vs Brazilian Associate's Degree Correlation Chart
The statistical analysis conducted on geographies consisting of 61,552,411 people shows a strong negative correlation between the proportion of Pima and percentage of population with at least associate's degree education in the United States with a correlation coefficient (R) of -0.707 and weighted average of 30.2%. Similarly, the statistical analysis conducted on geographies consisting of 323,936,214 people shows a moderate negative correlation between the proportion of Brazilians and percentage of population with at least associate's degree education in the United States with a correlation coefficient (R) of -0.447 and weighted average of 48.7%, a difference of 61.1%.
Associate's Degree Correlation Summary
| Measurement | Pima | Brazilian |
| Minimum | 1.2% | 5.3% |
| Maximum | 42.9% | 86.0% |
| Range | 41.8% | 80.8% |
| Mean | 21.3% | 45.3% |
| Median | 18.6% | 47.5% |
| Interquartile 25% (IQ1) | 13.8% | 38.9% |
| Interquartile 75% (IQ3) | 28.6% | 52.5% |
| Interquartile Range (IQR) | 14.8% | 13.6% |
| Standard Deviation (Sample) | 10.6% | 13.6% |
| Standard Deviation (Population) | 10.4% | 13.6% |
Similar Demographics by Associate's Degree
Demographics Similar to Pima by Associate's Degree
In terms of associate's degree, the demographic groups most similar to Pima are Yuman (31.3%, a difference of 3.4%), Tohono O'odham (31.8%, a difference of 5.1%), Yakama (32.3%, a difference of 6.9%), Houma (28.2%, a difference of 7.2%), and Inupiat (32.6%, a difference of 7.7%).
| Demographics | Rating | Rank | Associate's Degree |
| Mexicans | 0.0 /100 | #333 | Tragic 35.0% |
| Natives/Alaskans | 0.0 /100 | #334 | Tragic 34.9% |
| Spanish American Indians | 0.0 /100 | #335 | Tragic 34.9% |
| Hopi | 0.0 /100 | #336 | Tragic 34.6% |
| Lumbee | 0.0 /100 | #337 | Tragic 34.1% |
| Pueblo | 0.0 /100 | #338 | Tragic 34.0% |
| Immigrants | Mexico | 0.0 /100 | #339 | Tragic 33.7% |
| Navajo | 0.0 /100 | #340 | Tragic 32.6% |
| Inupiat | 0.0 /100 | #341 | Tragic 32.6% |
| Yakama | 0.0 /100 | #342 | Tragic 32.3% |
| Tohono O'odham | 0.0 /100 | #343 | Tragic 31.8% |
| Yuman | 0.0 /100 | #344 | Tragic 31.3% |
| Pima | 0.0 /100 | #345 | Tragic 30.2% |
| Houma | 0.0 /100 | #346 | Tragic 28.2% |
| Yup'ik | 0.0 /100 | #347 | Tragic 25.0% |
Demographics Similar to Brazilians by Associate's Degree
In terms of associate's degree, the demographic groups most similar to Brazilians are Italian (48.7%, a difference of 0.060%), Ugandan (48.7%, a difference of 0.070%), Alsatian (48.8%, a difference of 0.29%), Serbian (48.5%, a difference of 0.30%), and Chinese (48.5%, a difference of 0.31%).
| Demographics | Rating | Rank | Associate's Degree |
| British | 95.0 /100 | #116 | Exceptional 48.9% |
| Afghans | 94.8 /100 | #117 | Exceptional 48.9% |
| Albanians | 94.7 /100 | #118 | Exceptional 48.8% |
| Lebanese | 94.6 /100 | #119 | Exceptional 48.8% |
| Alsatians | 94.6 /100 | #120 | Exceptional 48.8% |
| Ugandans | 93.9 /100 | #121 | Exceptional 48.7% |
| Italians | 93.9 /100 | #122 | Exceptional 48.7% |
| Brazilians | 93.7 /100 | #123 | Exceptional 48.7% |
| Serbians | 92.6 /100 | #124 | Exceptional 48.5% |
| Chinese | 92.5 /100 | #125 | Exceptional 48.5% |
| Immigrants | Syria | 92.2 /100 | #126 | Exceptional 48.5% |
| Immigrants | Uganda | 92.1 /100 | #127 | Exceptional 48.5% |
| Immigrants | Eastern Africa | 91.6 /100 | #128 | Exceptional 48.4% |
| Swedes | 91.5 /100 | #129 | Exceptional 48.4% |
| Immigrants | Jordan | 91.2 /100 | #130 | Exceptional 48.4% |