Pima vs Immigrants from Switzerland Associate's Degree

COMPARE

Pima
Race
Ancestry
AfghanAfricanAlaska NativeAlaskan AthabascanAlbanianAleutAlsatianAmericanApacheArabArapahoArgentineanArmenianAssyrian/Chaldean/SyriacAustralianAustrianBahamianBangladeshiBarbadianBasqueBelgianBelizeanBermudanBhutaneseBlackfeetBolivianBrazilianBritishBritish West IndianBulgarianBurmeseCajunCambodianCanadianCape VerdeanCarpatho RusynCelticCentral AmericanCentral American IndianCherokeeCheyenneChickasawChileanChineseChippewaChoctawColombianColvilleComancheCosta RicanCreeCreekCroatianCrowCubanCypriotCzechCzechoslovakianDanishDelawareDominicanDutchDutch West IndianEastern EuropeanEcuadorianEgyptianEnglishEstonianEthiopianEuropeanFijianFilipinoFinnishFrenchFrench American IndianFrench CanadianGermanGerman RussianGhanaianGreekGuamanian/ChamorroGuatemalanGuyaneseHaitianHmongHonduranHopiHoumaHungarianIcelanderIndian (Asian)IndonesianInupiatIranianIraqiIrishIroquoisIsraeliItalianJamaicanJapaneseJordanianKenyanKiowaKoreanLaotianLatvianLebaneseLiberianLithuanianLumbeeLuxembourgerMacedonianMalaysianMalteseMarshalleseMenomineeMexicanMexican American IndianMongolianMoroccanNative HawaiianNavajoNepaleseNew ZealanderNicaraguanNigerianNorthern EuropeanNorwegianOkinawanOsageOttawaPaiutePakistaniPalestinianPanamanianParaguayanPennsylvania GermanPeruvianPimaPolishPortuguesePotawatomiPuebloPuerto RicanPuget Sound SalishRomanianRussianSalvadoranSamoanScandinavianScotch-IrishScottishSeminoleSenegaleseSerbianShoshoneSierra LeoneanSiouxSlavicSlovakSloveneSomaliSouth AfricanSouth AmericanSouth American IndianSoviet UnionSpaniardSpanishSpanish AmericanSpanish American IndianSri LankanSubsaharan AfricanSudaneseSwedishSwissSyrianTaiwaneseThaiTlingit-HaidaTohono O'OdhamTonganTrinidadian and TobagonianTsimshianTurkishU.S. Virgin IslanderUgandanUkrainianUruguayanUteVenezuelanVietnameseWelshWest IndianYakamaYaquiYugoslavianYumanYup'ikZimbabwean
Immigration
NonimmigrantsImmigrantsAfghanistanAfricaAlbaniaArgentinaArmeniaAsiaAustraliaAustriaBahamasBangladeshBarbadosBelarusBelgiumBelizeBoliviaBosnia and HerzegovinaBrazilBulgariaBurma/MyanmarCabo VerdeCambodiaCameroonCanadaCaribbeanCentral AmericaChileChinaColombiaCongoCosta RicaCroatiaCubaCzechoslovakiaDenmarkDominicaDominican RepublicEastern AfricaEastern AsiaEastern EuropeEcuadorEgyptEl SalvadorEnglandEritreaEthiopiaEuropeFijiFranceGermanyGhanaGreeceGrenadaGuatemalaGuyanaHaitiHondurasHong KongHungaryIndiaIndonesiaIranIraqIrelandIsraelItalyJamaicaJapanJordanKazakhstanKenyaKoreaKuwaitLaosLatin AmericaLatviaLebanonLiberiaLithuaniaMalaysiaMexicoMicronesiaMiddle AfricaMoldovaMoroccoNepalNetherlandsNicaraguaNigeriaNorth AmericaNorth MacedoniaNorthern AfricaNorthern EuropeNorwayOceaniaPakistanPanamaPeruPhilippinesPolandPortugalRomaniaRussiaSaudi ArabiaScotlandSenegalSerbiaSierra LeoneSingaporeSomaliaSouth AfricaSouth AmericaSouth Central AsiaSouth Eastern AsiaSouthern EuropeSpainSri LankaSt. Vincent and the GrenadinesSudanSwedenSyriaTaiwanThailandTrinidad and TobagoTurkeyUgandaUkraineUruguayUzbekistanVenezuelaVietnamWest IndiesWestern AfricaWestern AsiaWestern EuropeYemenZaireZimbabweAzores
Immigrants from Switzerland
Race
Ancestry
AfghanAfricanAlaska NativeAlaskan AthabascanAlbanianAleutAlsatianAmericanApacheArabArapahoArgentineanArmenianAssyrian/Chaldean/SyriacAustralianAustrianBahamianBangladeshiBarbadianBasqueBelgianBelizeanBermudanBhutaneseBlackfeetBolivianBrazilianBritishBritish West IndianBulgarianBurmeseCajunCambodianCanadianCape VerdeanCarpatho RusynCelticCentral AmericanCentral American IndianCherokeeCheyenneChickasawChileanChineseChippewaChoctawColombianColvilleComancheCosta RicanCreeCreekCroatianCrowCubanCypriotCzechCzechoslovakianDanishDelawareDominicanDutchDutch West IndianEastern EuropeanEcuadorianEgyptianEnglishEstonianEthiopianEuropeanFijianFilipinoFinnishFrenchFrench American IndianFrench CanadianGermanGerman RussianGhanaianGreekGuamanian/ChamorroGuatemalanGuyaneseHaitianHmongHonduranHopiHoumaHungarianIcelanderIndian (Asian)IndonesianInupiatIranianIraqiIrishIroquoisIsraeliItalianJamaicanJapaneseJordanianKenyanKiowaKoreanLaotianLatvianLebaneseLiberianLithuanianLumbeeLuxembourgerMacedonianMalaysianMalteseMarshalleseMenomineeMexicanMexican American IndianMongolianMoroccanNative HawaiianNavajoNepaleseNew ZealanderNicaraguanNigerianNorthern EuropeanNorwegianOkinawanOsageOttawaPaiutePakistaniPalestinianPanamanianParaguayanPennsylvania GermanPeruvianPolishPortuguesePotawatomiPuebloPuerto RicanPuget Sound SalishRomanianRussianSalvadoranSamoanScandinavianScotch-IrishScottishSeminoleSenegaleseSerbianShoshoneSierra LeoneanSiouxSlavicSlovakSloveneSomaliSouth AfricanSouth AmericanSouth American IndianSoviet UnionSpaniardSpanishSpanish AmericanSpanish American IndianSri LankanSubsaharan AfricanSudaneseSwedishSwissSyrianTaiwaneseThaiTlingit-HaidaTohono O'OdhamTonganTrinidadian and TobagonianTsimshianTurkishU.S. Virgin IslanderUgandanUkrainianUruguayanUteVenezuelanVietnameseWelshWest IndianYakamaYaquiYugoslavianYumanYup'ikZimbabwean
Immigration
NonimmigrantsImmigrantsAfghanistanAfricaAlbaniaArgentinaArmeniaAsiaAustraliaAustriaBahamasBangladeshBarbadosBelarusBelgiumBelizeBoliviaBosnia and HerzegovinaBrazilBulgariaBurma/MyanmarCabo VerdeCambodiaCameroonCanadaCaribbeanCentral AmericaChileChinaColombiaCongoCosta RicaCroatiaCubaCzechoslovakiaDenmarkDominicaDominican RepublicEastern AfricaEastern AsiaEastern EuropeEcuadorEgyptEl SalvadorEnglandEritreaEthiopiaEuropeFijiFranceGermanyGhanaGreeceGrenadaGuatemalaGuyanaHaitiHondurasHong KongHungaryIndiaIndonesiaIranIraqIrelandIsraelItalyJamaicaJapanJordanKazakhstanKenyaKoreaKuwaitLaosLatin AmericaLatviaLebanonLiberiaLithuaniaMalaysiaMexicoMicronesiaMiddle AfricaMoldovaMoroccoNepalNetherlandsNicaraguaNigeriaNorth AmericaNorth MacedoniaNorthern AfricaNorthern EuropeNorwayOceaniaPakistanPanamaPeruPhilippinesPolandPortugalRomaniaRussiaSaudi ArabiaScotlandSenegalSerbiaSierra LeoneSingaporeSomaliaSouth AfricaSouth AmericaSouth Central AsiaSouth Eastern AsiaSouthern EuropeSpainSri LankaSt. Vincent and the GrenadinesSudanSwedenSwitzerlandSyriaTaiwanThailandTrinidad and TobagoTurkeyUgandaUkraineUruguayUzbekistanVenezuelaVietnamWest IndiesWestern AfricaWestern AsiaWestern EuropeYemenZaireZimbabweAzores
Associate's Degree
Income
Poverty
Unemployment
Labor Participation
Family Structure
Vehicle Availability
Education Level
Disability

Associate's Degree Comparison

Pima

Immigrants from Switzerland

Tragic
Exceptional
30.2%
ASSOCIATE'S DEGREE
0.0/ 100
METRIC RATING
345th/ 347
METRIC RANK
54.5%
ASSOCIATE'S DEGREE
100.0/ 100
METRIC RATING
25th/ 347
METRIC RANK

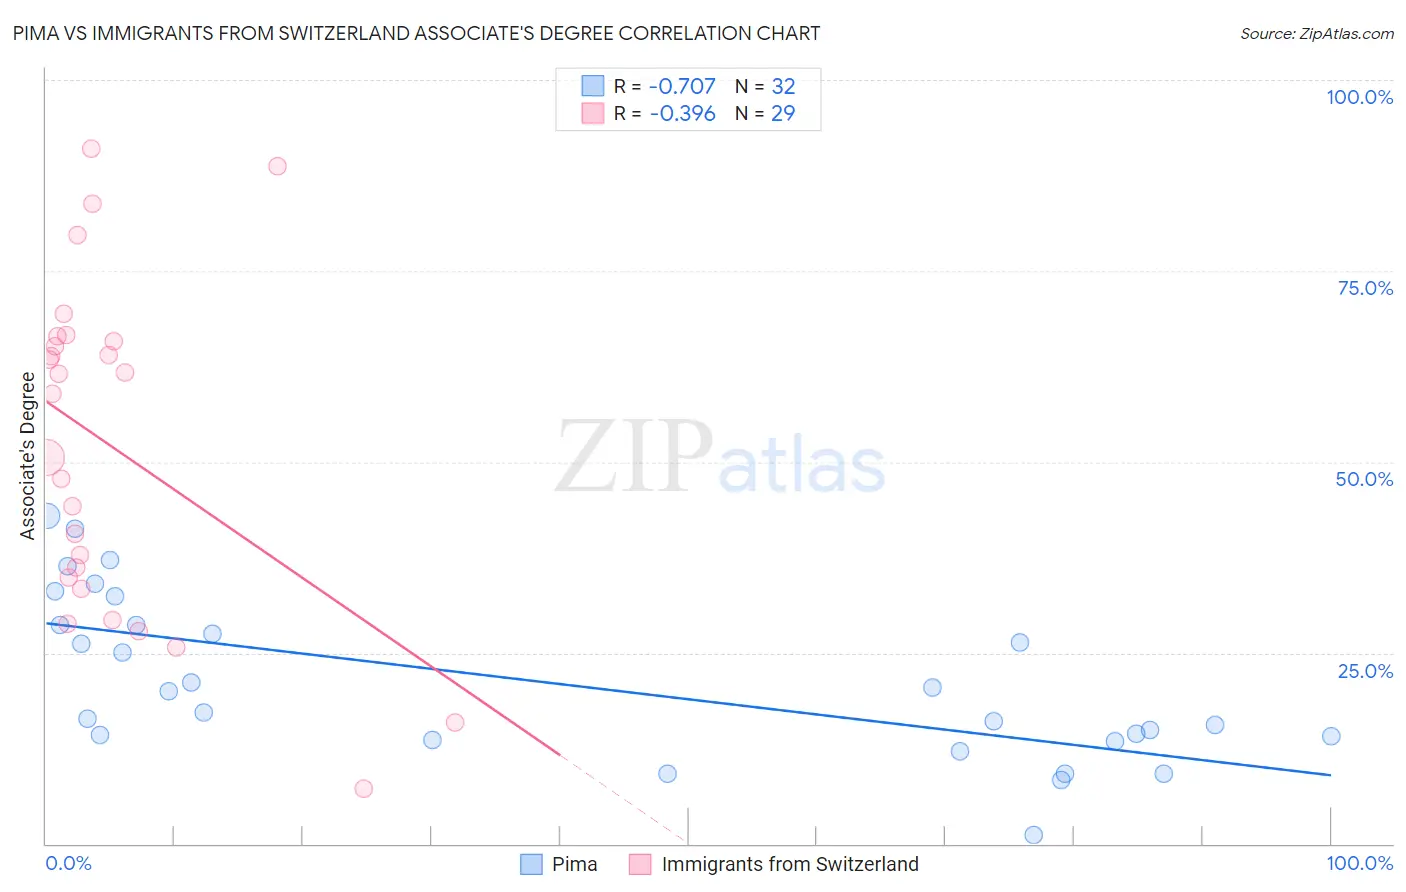
Pima vs Immigrants from Switzerland Associate's Degree Correlation Chart

The statistical analysis conducted on geographies consisting of 61,552,411 people shows a strong negative correlation between the proportion of Pima and percentage of population with at least associate's degree education in the United States with a correlation coefficient (R) of -0.707 and weighted average of 30.2%. Similarly, the statistical analysis conducted on geographies consisting of 148,083,488 people shows a mild negative correlation between the proportion of Immigrants from Switzerland and percentage of population with at least associate's degree education in the United States with a correlation coefficient (R) of -0.396 and weighted average of 54.5%, a difference of 80.4%.
Pima vs Immigrants from Switzerland Associate's Degree

Associate's Degree Correlation Summary

MeasurementPimaImmigrants from Switzerland
Minimum1.2%7.2%
Maximum42.9%91.0%
Range41.8%83.7%
Mean21.3%52.1%
Median18.6%58.9%
Interquartile 25% (IQ1)13.8%34.1%
Interquartile 75% (IQ3)28.6%66.1%
Interquartile Range (IQR)14.8%32.0%
Standard Deviation (Sample)10.6%21.8%
Standard Deviation (Population)10.4%21.4%

Similar Demographics by Associate's Degree

Demographics Similar to Pima by Associate's Degree

In terms of associate's degree, the demographic groups most similar to Pima are Yuman (31.3%, a difference of 3.4%), Tohono O'odham (31.8%, a difference of 5.1%), Yakama (32.3%, a difference of 6.9%), Houma (28.2%, a difference of 7.2%), and Inupiat (32.6%, a difference of 7.7%).
DemographicsRating | RankAssociate's Degree
Mexicans
0.0
/100
|
#333
Tragic
35.0%
Natives/Alaskans
0.0
/100
|
#334
Tragic
34.9%
Spanish American Indians
0.0
/100
|
#335
Tragic
34.9%
Hopi
0.0
/100
|
#336
Tragic
34.6%
Lumbee
0.0
/100
|
#337
Tragic
34.1%
Pueblo
0.0
/100
|
#338
Tragic
34.0%
Immigrants | Mexico
0.0
/100
|
#339
Tragic
33.7%
Navajo
0.0
/100
|
#340
Tragic
32.6%
Inupiat
0.0
/100
|
#341
Tragic
32.6%
Yakama
0.0
/100
|
#342
Tragic
32.3%
Tohono O'odham
0.0
/100
|
#343
Tragic
31.8%
Yuman
0.0
/100
|
#344
Tragic
31.3%
Pima
0.0
/100
|
#345
Tragic
30.2%
Houma
0.0
/100
|
#346
Tragic
28.2%
Yup'ik
0.0
/100
|
#347
Tragic
25.0%

Demographics Similar to Immigrants from Switzerland by Associate's Degree

In terms of associate's degree, the demographic groups most similar to Immigrants from Switzerland are Immigrants from Korea (54.5%, a difference of 0.030%), Immigrants from Belgium (54.5%, a difference of 0.030%), Immigrants from Japan (54.6%, a difference of 0.12%), Burmese (54.6%, a difference of 0.12%), and Immigrants from Sweden (54.6%, a difference of 0.16%).
DemographicsRating | RankAssociate's Degree
Indians (Asian)
100.0
/100
|
#18
Exceptional
54.8%
Immigrants | Ireland
100.0
/100
|
#19
Exceptional
54.7%
Cambodians
100.0
/100
|
#20
Exceptional
54.6%
Immigrants | Sweden
100.0
/100
|
#21
Exceptional
54.6%
Immigrants | Japan
100.0
/100
|
#22
Exceptional
54.6%
Burmese
100.0
/100
|
#23
Exceptional
54.6%
Immigrants | Korea
100.0
/100
|
#24
Exceptional
54.5%
Immigrants | Switzerland
100.0
/100
|
#25
Exceptional
54.5%
Immigrants | Belgium
100.0
/100
|
#26
Exceptional
54.5%
Latvians
100.0
/100
|
#27
Exceptional
53.9%
Turks
100.0
/100
|
#28
Exceptional
53.9%
Immigrants | France
100.0
/100
|
#29
Exceptional
53.9%
Immigrants | Sri Lanka
100.0
/100
|
#30
Exceptional
53.7%
Immigrants | Northern Europe
100.0
/100
|
#31
Exceptional
53.5%
Immigrants | Turkey
100.0
/100
|
#32
Exceptional
53.4%