Pima vs Immigrants from Northern Europe Bachelor's Degree

COMPARE

Pima
Race
Ancestry
AfghanAfricanAlaska NativeAlaskan AthabascanAlbanianAleutAlsatianAmericanApacheArabArapahoArgentineanArmenianAssyrian/Chaldean/SyriacAustralianAustrianBahamianBangladeshiBarbadianBasqueBelgianBelizeanBermudanBhutaneseBlackfeetBolivianBrazilianBritishBritish West IndianBulgarianBurmeseCajunCambodianCanadianCape VerdeanCarpatho RusynCelticCentral AmericanCentral American IndianCherokeeCheyenneChickasawChileanChineseChippewaChoctawColombianColvilleComancheCosta RicanCreeCreekCroatianCrowCubanCypriotCzechCzechoslovakianDanishDelawareDominicanDutchDutch West IndianEastern EuropeanEcuadorianEgyptianEnglishEstonianEthiopianEuropeanFijianFilipinoFinnishFrenchFrench American IndianFrench CanadianGermanGerman RussianGhanaianGreekGuamanian/ChamorroGuatemalanGuyaneseHaitianHmongHonduranHopiHoumaHungarianIcelanderIndian (Asian)IndonesianInupiatIranianIraqiIrishIroquoisIsraeliItalianJamaicanJapaneseJordanianKenyanKiowaKoreanLaotianLatvianLebaneseLiberianLithuanianLumbeeLuxembourgerMacedonianMalaysianMalteseMarshalleseMenomineeMexicanMexican American IndianMongolianMoroccanNative HawaiianNavajoNepaleseNew ZealanderNicaraguanNigerianNorthern EuropeanNorwegianOkinawanOsageOttawaPaiutePakistaniPalestinianPanamanianParaguayanPennsylvania GermanPeruvianPimaPolishPortuguesePotawatomiPuebloPuerto RicanPuget Sound SalishRomanianRussianSalvadoranSamoanScandinavianScotch-IrishScottishSeminoleSenegaleseSerbianShoshoneSierra LeoneanSiouxSlavicSlovakSloveneSomaliSouth AfricanSouth AmericanSouth American IndianSoviet UnionSpaniardSpanishSpanish AmericanSpanish American IndianSri LankanSubsaharan AfricanSudaneseSwedishSwissSyrianTaiwaneseThaiTlingit-HaidaTohono O'OdhamTonganTrinidadian and TobagonianTsimshianTurkishU.S. Virgin IslanderUgandanUkrainianUruguayanUteVenezuelanVietnameseWelshWest IndianYakamaYaquiYugoslavianYumanYup'ikZimbabwean
Immigration
NonimmigrantsImmigrantsAfghanistanAfricaAlbaniaArgentinaArmeniaAsiaAustraliaAustriaBahamasBangladeshBarbadosBelarusBelgiumBelizeBoliviaBosnia and HerzegovinaBrazilBulgariaBurma/MyanmarCabo VerdeCambodiaCameroonCanadaCaribbeanCentral AmericaChileChinaColombiaCongoCosta RicaCroatiaCubaCzechoslovakiaDenmarkDominicaDominican RepublicEastern AfricaEastern AsiaEastern EuropeEcuadorEgyptEl SalvadorEnglandEritreaEthiopiaEuropeFijiFranceGermanyGhanaGreeceGrenadaGuatemalaGuyanaHaitiHondurasHong KongHungaryIndiaIndonesiaIranIraqIrelandIsraelItalyJamaicaJapanJordanKazakhstanKenyaKoreaKuwaitLaosLatin AmericaLatviaLebanonLiberiaLithuaniaMalaysiaMexicoMicronesiaMiddle AfricaMoldovaMoroccoNepalNetherlandsNicaraguaNigeriaNorth AmericaNorth MacedoniaNorthern AfricaNorwayOceaniaPakistanPanamaPeruPhilippinesPolandPortugalRomaniaRussiaSaudi ArabiaScotlandSenegalSerbiaSierra LeoneSingaporeSomaliaSouth AfricaSouth AmericaSouth Central AsiaSouth Eastern AsiaSouthern EuropeSpainSri LankaSt. Vincent and the GrenadinesSudanSwedenSwitzerlandSyriaTaiwanThailandTrinidad and TobagoTurkeyUgandaUkraineUruguayUzbekistanVenezuelaVietnamWest IndiesWestern AfricaWestern AsiaWestern EuropeYemenZaireZimbabweAzores
Immigrants from Northern Europe
Race
Ancestry
AfghanAfricanAlaska NativeAlaskan AthabascanAlbanianAleutAlsatianAmericanApacheArabArapahoArgentineanArmenianAssyrian/Chaldean/SyriacAustralianAustrianBahamianBangladeshiBarbadianBasqueBelgianBelizeanBermudanBhutaneseBlackfeetBolivianBrazilianBritishBritish West IndianBulgarianBurmeseCajunCambodianCanadianCape VerdeanCarpatho RusynCelticCentral AmericanCentral American IndianCherokeeCheyenneChickasawChileanChineseChippewaChoctawColombianColvilleComancheCosta RicanCreeCreekCroatianCrowCubanCypriotCzechCzechoslovakianDanishDelawareDominicanDutchDutch West IndianEastern EuropeanEcuadorianEgyptianEnglishEstonianEthiopianEuropeanFijianFilipinoFinnishFrenchFrench American IndianFrench CanadianGermanGerman RussianGhanaianGreekGuamanian/ChamorroGuatemalanGuyaneseHaitianHmongHonduranHopiHoumaHungarianIcelanderIndian (Asian)IndonesianInupiatIranianIraqiIrishIroquoisIsraeliItalianJamaicanJapaneseJordanianKenyanKiowaKoreanLaotianLatvianLebaneseLiberianLithuanianLumbeeLuxembourgerMacedonianMalaysianMalteseMarshalleseMenomineeMexicanMexican American IndianMongolianMoroccanNative HawaiianNavajoNepaleseNew ZealanderNicaraguanNigerianNorthern EuropeanNorwegianOkinawanOsageOttawaPaiutePakistaniPalestinianPanamanianParaguayanPennsylvania GermanPeruvianPolishPortuguesePotawatomiPuebloPuerto RicanPuget Sound SalishRomanianRussianSalvadoranSamoanScandinavianScotch-IrishScottishSeminoleSenegaleseSerbianShoshoneSierra LeoneanSiouxSlavicSlovakSloveneSomaliSouth AfricanSouth AmericanSouth American IndianSoviet UnionSpaniardSpanishSpanish AmericanSpanish American IndianSri LankanSubsaharan AfricanSudaneseSwedishSwissSyrianTaiwaneseThaiTlingit-HaidaTohono O'OdhamTonganTrinidadian and TobagonianTsimshianTurkishU.S. Virgin IslanderUgandanUkrainianUruguayanUteVenezuelanVietnameseWelshWest IndianYakamaYaquiYugoslavianYumanYup'ikZimbabwean
Immigration
NonimmigrantsImmigrantsAfghanistanAfricaAlbaniaArgentinaArmeniaAsiaAustraliaAustriaBahamasBangladeshBarbadosBelarusBelgiumBelizeBoliviaBosnia and HerzegovinaBrazilBulgariaBurma/MyanmarCabo VerdeCambodiaCameroonCanadaCaribbeanCentral AmericaChileChinaColombiaCongoCosta RicaCroatiaCubaCzechoslovakiaDenmarkDominicaDominican RepublicEastern AfricaEastern AsiaEastern EuropeEcuadorEgyptEl SalvadorEnglandEritreaEthiopiaEuropeFijiFranceGermanyGhanaGreeceGrenadaGuatemalaGuyanaHaitiHondurasHong KongHungaryIndiaIndonesiaIranIraqIrelandIsraelItalyJamaicaJapanJordanKazakhstanKenyaKoreaKuwaitLaosLatin AmericaLatviaLebanonLiberiaLithuaniaMalaysiaMexicoMicronesiaMiddle AfricaMoldovaMoroccoNepalNetherlandsNicaraguaNigeriaNorth AmericaNorth MacedoniaNorthern AfricaNorthern EuropeNorwayOceaniaPakistanPanamaPeruPhilippinesPolandPortugalRomaniaRussiaSaudi ArabiaScotlandSenegalSerbiaSierra LeoneSingaporeSomaliaSouth AfricaSouth AmericaSouth Central AsiaSouth Eastern AsiaSouthern EuropeSpainSri LankaSt. Vincent and the GrenadinesSudanSwedenSwitzerlandSyriaTaiwanThailandTrinidad and TobagoTurkeyUgandaUkraineUruguayUzbekistanVenezuelaVietnamWest IndiesWestern AfricaWestern AsiaWestern EuropeYemenZaireZimbabweAzores
Bachelor's Degree
Income
Poverty
Unemployment
Labor Participation
Family Structure
Vehicle Availability
Education Level
Disability

Bachelor's Degree Comparison

Pima

Immigrants from Northern Europe

Tragic
Exceptional
23.2%
BACHELOR'S DEGREE
0.0/ 100
METRIC RATING
345th/ 347
METRIC RANK
45.6%
BACHELOR'S DEGREE
100.0/ 100
METRIC RATING
33rd/ 347
METRIC RANK

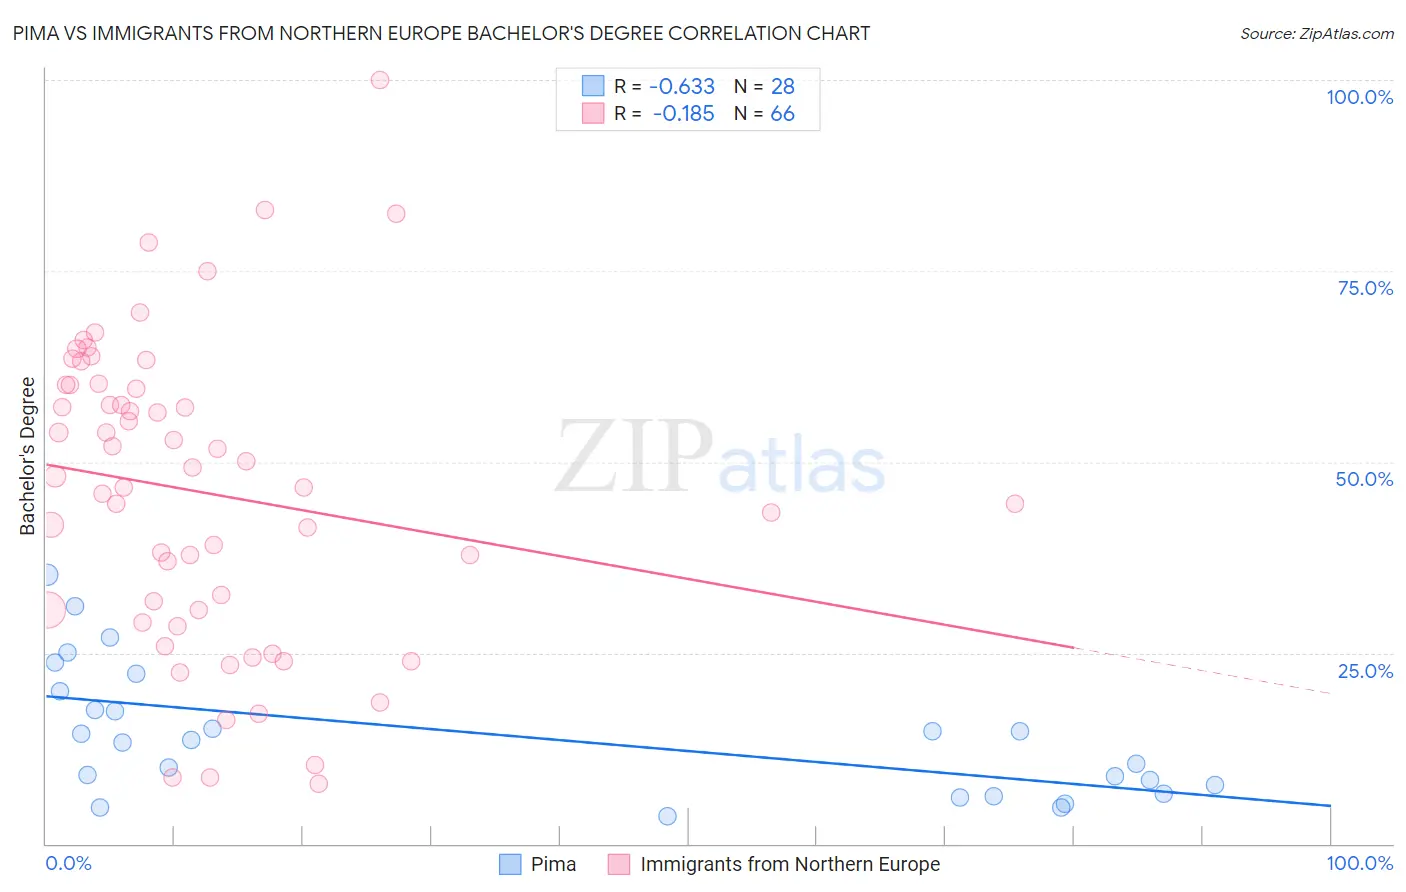
Pima vs Immigrants from Northern Europe Bachelor's Degree Correlation Chart

The statistical analysis conducted on geographies consisting of 61,550,117 people shows a significant negative correlation between the proportion of Pima and percentage of population with at least bachelor's degree education in the United States with a correlation coefficient (R) of -0.633 and weighted average of 23.2%. Similarly, the statistical analysis conducted on geographies consisting of 477,184,497 people shows a poor negative correlation between the proportion of Immigrants from Northern Europe and percentage of population with at least bachelor's degree education in the United States with a correlation coefficient (R) of -0.185 and weighted average of 45.6%, a difference of 96.6%.
Pima vs Immigrants from Northern Europe Bachelor's Degree

Bachelor's Degree Correlation Summary

MeasurementPimaImmigrants from Northern Europe
Minimum3.5%7.8%
Maximum35.2%100.0%
Range31.6%92.2%
Mean14.2%46.0%
Median13.4%47.4%
Interquartile 25% (IQ1)7.1%30.6%
Interquartile 75% (IQ3)18.7%60.1%
Interquartile Range (IQR)11.6%29.5%
Standard Deviation (Sample)8.5%20.0%
Standard Deviation (Population)8.3%19.8%

Similar Demographics by Bachelor's Degree

Demographics Similar to Pima by Bachelor's Degree

In terms of bachelor's degree, the demographic groups most similar to Pima are Navajo (23.6%, a difference of 1.8%), Tohono O'odham (24.4%, a difference of 5.2%), Yakama (24.5%, a difference of 5.4%), Yuman (24.5%, a difference of 5.7%), and Lumbee (24.8%, a difference of 6.7%).
DemographicsRating | RankBachelor's Degree
Mexicans
0.0
/100
|
#333
Tragic
27.1%
Arapaho
0.0
/100
|
#334
Tragic
26.6%
Natives/Alaskans
0.0
/100
|
#335
Tragic
26.3%
Immigrants | Mexico
0.0
/100
|
#336
Tragic
26.1%
Inupiat
0.0
/100
|
#337
Tragic
25.8%
Pueblo
0.0
/100
|
#338
Tragic
25.5%
Hopi
0.0
/100
|
#339
Tragic
25.3%
Lumbee
0.0
/100
|
#340
Tragic
24.8%
Yuman
0.0
/100
|
#341
Tragic
24.5%
Yakama
0.0
/100
|
#342
Tragic
24.5%
Tohono O'odham
0.0
/100
|
#343
Tragic
24.4%
Navajo
0.0
/100
|
#344
Tragic
23.6%
Pima
0.0
/100
|
#345
Tragic
23.2%
Houma
0.0
/100
|
#346
Tragic
21.4%
Yup'ik
0.0
/100
|
#347
Tragic
19.4%

Demographics Similar to Immigrants from Northern Europe by Bachelor's Degree

In terms of bachelor's degree, the demographic groups most similar to Immigrants from Northern Europe are Immigrants from Denmark (45.4%, a difference of 0.45%), Immigrants from Russia (45.4%, a difference of 0.48%), Mongolian (45.4%, a difference of 0.50%), Russian (45.3%, a difference of 0.65%), and Immigrants from Turkey (46.0%, a difference of 0.70%).
DemographicsRating | RankBachelor's Degree
Immigrants | Japan
100.0
/100
|
#26
Exceptional
46.8%
Immigrants | France
100.0
/100
|
#27
Exceptional
46.4%
Turks
100.0
/100
|
#28
Exceptional
46.2%
Israelis
100.0
/100
|
#29
Exceptional
46.1%
Immigrants | Sri Lanka
100.0
/100
|
#30
Exceptional
46.1%
Latvians
100.0
/100
|
#31
Exceptional
46.1%
Immigrants | Turkey
100.0
/100
|
#32
Exceptional
46.0%
Immigrants | Northern Europe
100.0
/100
|
#33
Exceptional
45.6%
Immigrants | Denmark
100.0
/100
|
#34
Exceptional
45.4%
Immigrants | Russia
100.0
/100
|
#35
Exceptional
45.4%
Mongolians
100.0
/100
|
#36
Exceptional
45.4%
Russians
100.0
/100
|
#37
Exceptional
45.3%
Bulgarians
100.0
/100
|
#38
Exceptional
45.3%
Immigrants | Latvia
100.0
/100
|
#39
Exceptional
45.1%
Immigrants | Belarus
100.0
/100
|
#40
Exceptional
45.0%