Immigrants from El Salvador vs Brazilian Associate's Degree
COMPARE
Immigrants from El Salvador
Brazilian
Associate's Degree
Associate's Degree Comparison
Immigrants from El Salvador
Brazilians
38.4%
ASSOCIATE'S DEGREE
0.0/ 100
METRIC RATING
307th/ 347
METRIC RANK
48.7%
ASSOCIATE'S DEGREE
93.7/ 100
METRIC RATING
123rd/ 347
METRIC RANK
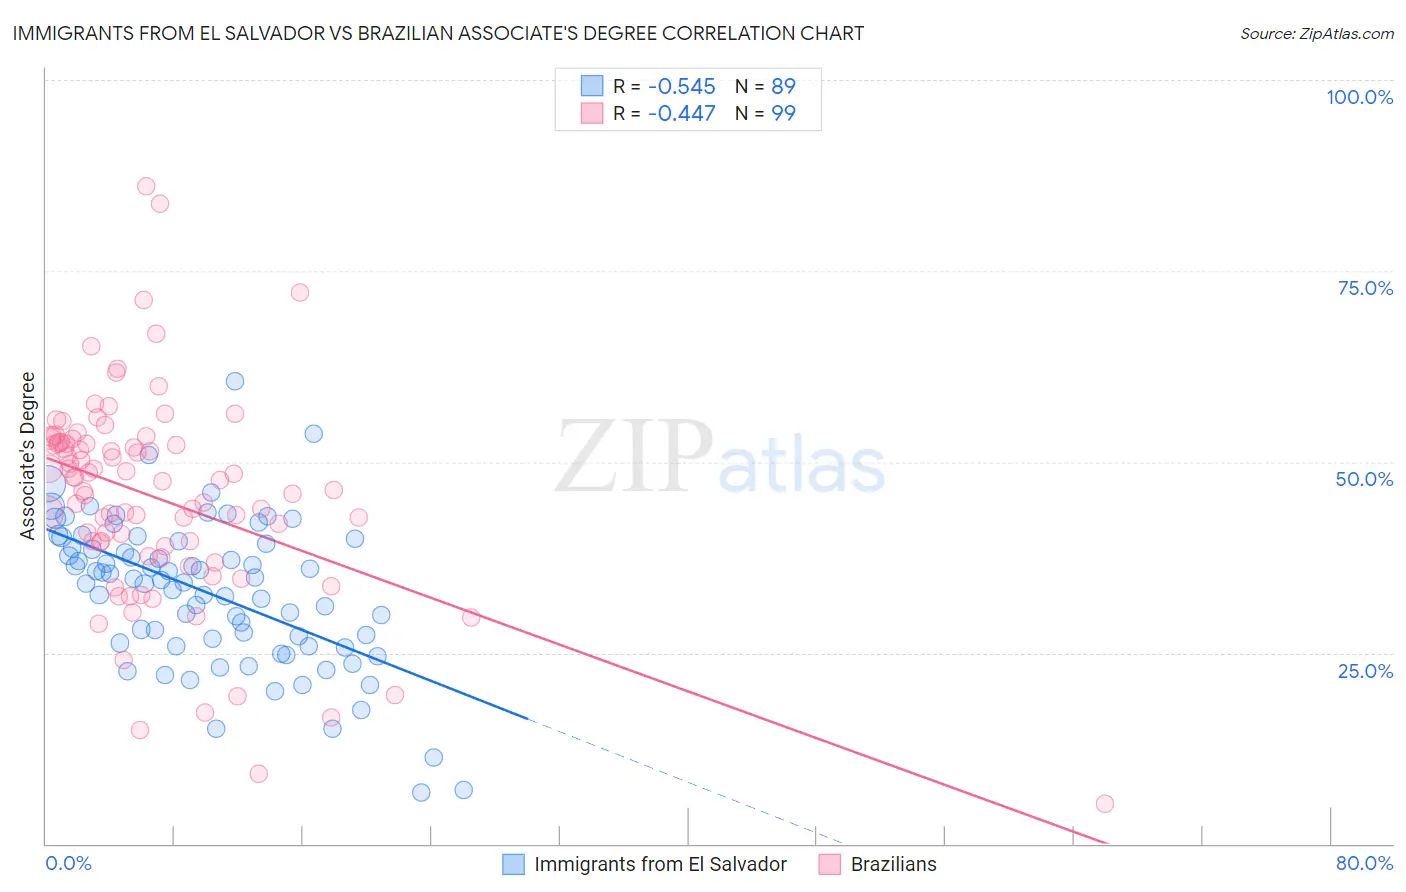
Immigrants from El Salvador vs Brazilian Associate's Degree Correlation Chart
The statistical analysis conducted on geographies consisting of 357,840,012 people shows a substantial negative correlation between the proportion of Immigrants from El Salvador and percentage of population with at least associate's degree education in the United States with a correlation coefficient (R) of -0.545 and weighted average of 38.4%. Similarly, the statistical analysis conducted on geographies consisting of 323,936,214 people shows a moderate negative correlation between the proportion of Brazilians and percentage of population with at least associate's degree education in the United States with a correlation coefficient (R) of -0.447 and weighted average of 48.7%, a difference of 26.8%.
Associate's Degree Correlation Summary
| Measurement | Immigrants from El Salvador | Brazilian |
| Minimum | 6.6% | 5.3% |
| Maximum | 60.5% | 86.0% |
| Range | 53.9% | 80.8% |
| Mean | 32.9% | 45.3% |
| Median | 34.5% | 47.5% |
| Interquartile 25% (IQ1) | 26.1% | 38.9% |
| Interquartile 75% (IQ3) | 39.4% | 52.5% |
| Interquartile Range (IQR) | 13.3% | 13.6% |
| Standard Deviation (Sample) | 9.6% | 13.6% |
| Standard Deviation (Population) | 9.6% | 13.6% |
Similar Demographics by Associate's Degree
Demographics Similar to Immigrants from El Salvador by Associate's Degree
In terms of associate's degree, the demographic groups most similar to Immigrants from El Salvador are Shoshone (38.4%, a difference of 0.040%), Immigrants from Honduras (38.5%, a difference of 0.11%), Sioux (38.5%, a difference of 0.17%), Guatemalan (38.5%, a difference of 0.23%), and Colville (38.5%, a difference of 0.31%).
| Demographics | Rating | Rank | Associate's Degree |
| Chickasaw | 0.0 /100 | #300 | Tragic 38.6% |
| Tsimshian | 0.0 /100 | #301 | Tragic 38.6% |
| Colville | 0.0 /100 | #302 | Tragic 38.5% |
| Guatemalans | 0.0 /100 | #303 | Tragic 38.5% |
| Sioux | 0.0 /100 | #304 | Tragic 38.5% |
| Immigrants | Honduras | 0.0 /100 | #305 | Tragic 38.5% |
| Shoshone | 0.0 /100 | #306 | Tragic 38.4% |
| Immigrants | El Salvador | 0.0 /100 | #307 | Tragic 38.4% |
| Mexican American Indians | 0.0 /100 | #308 | Tragic 38.2% |
| Immigrants | Guatemala | 0.0 /100 | #309 | Tragic 38.1% |
| Immigrants | Dominican Republic | 0.0 /100 | #310 | Tragic 37.9% |
| Immigrants | Latin America | 0.0 /100 | #311 | Tragic 37.9% |
| Choctaw | 0.0 /100 | #312 | Tragic 37.8% |
| Hispanics or Latinos | 0.0 /100 | #313 | Tragic 37.7% |
| Seminole | 0.0 /100 | #314 | Tragic 37.7% |
Demographics Similar to Brazilians by Associate's Degree
In terms of associate's degree, the demographic groups most similar to Brazilians are Italian (48.7%, a difference of 0.060%), Ugandan (48.7%, a difference of 0.070%), Alsatian (48.8%, a difference of 0.29%), Serbian (48.5%, a difference of 0.30%), and Chinese (48.5%, a difference of 0.31%).
| Demographics | Rating | Rank | Associate's Degree |
| British | 95.0 /100 | #116 | Exceptional 48.9% |
| Afghans | 94.8 /100 | #117 | Exceptional 48.9% |
| Albanians | 94.7 /100 | #118 | Exceptional 48.8% |
| Lebanese | 94.6 /100 | #119 | Exceptional 48.8% |
| Alsatians | 94.6 /100 | #120 | Exceptional 48.8% |
| Ugandans | 93.9 /100 | #121 | Exceptional 48.7% |
| Italians | 93.9 /100 | #122 | Exceptional 48.7% |
| Brazilians | 93.7 /100 | #123 | Exceptional 48.7% |
| Serbians | 92.6 /100 | #124 | Exceptional 48.5% |
| Chinese | 92.5 /100 | #125 | Exceptional 48.5% |
| Immigrants | Syria | 92.2 /100 | #126 | Exceptional 48.5% |
| Immigrants | Uganda | 92.1 /100 | #127 | Exceptional 48.5% |
| Immigrants | Eastern Africa | 91.6 /100 | #128 | Exceptional 48.4% |
| Swedes | 91.5 /100 | #129 | Exceptional 48.4% |
| Immigrants | Jordan | 91.2 /100 | #130 | Exceptional 48.4% |