Native/Alaskan vs Immigrants from Zimbabwe High School Diploma
COMPARE
Native/Alaskan
Immigrants from Zimbabwe
High School Diploma
High School Diploma Comparison
Natives/Alaskans
Immigrants from Zimbabwe
85.6%
HIGH SCHOOL DIPLOMA
0.0/ 100
METRIC RATING
298th/ 347
METRIC RANK
90.3%
HIGH SCHOOL DIPLOMA
96.7/ 100
METRIC RATING
109th/ 347
METRIC RANK
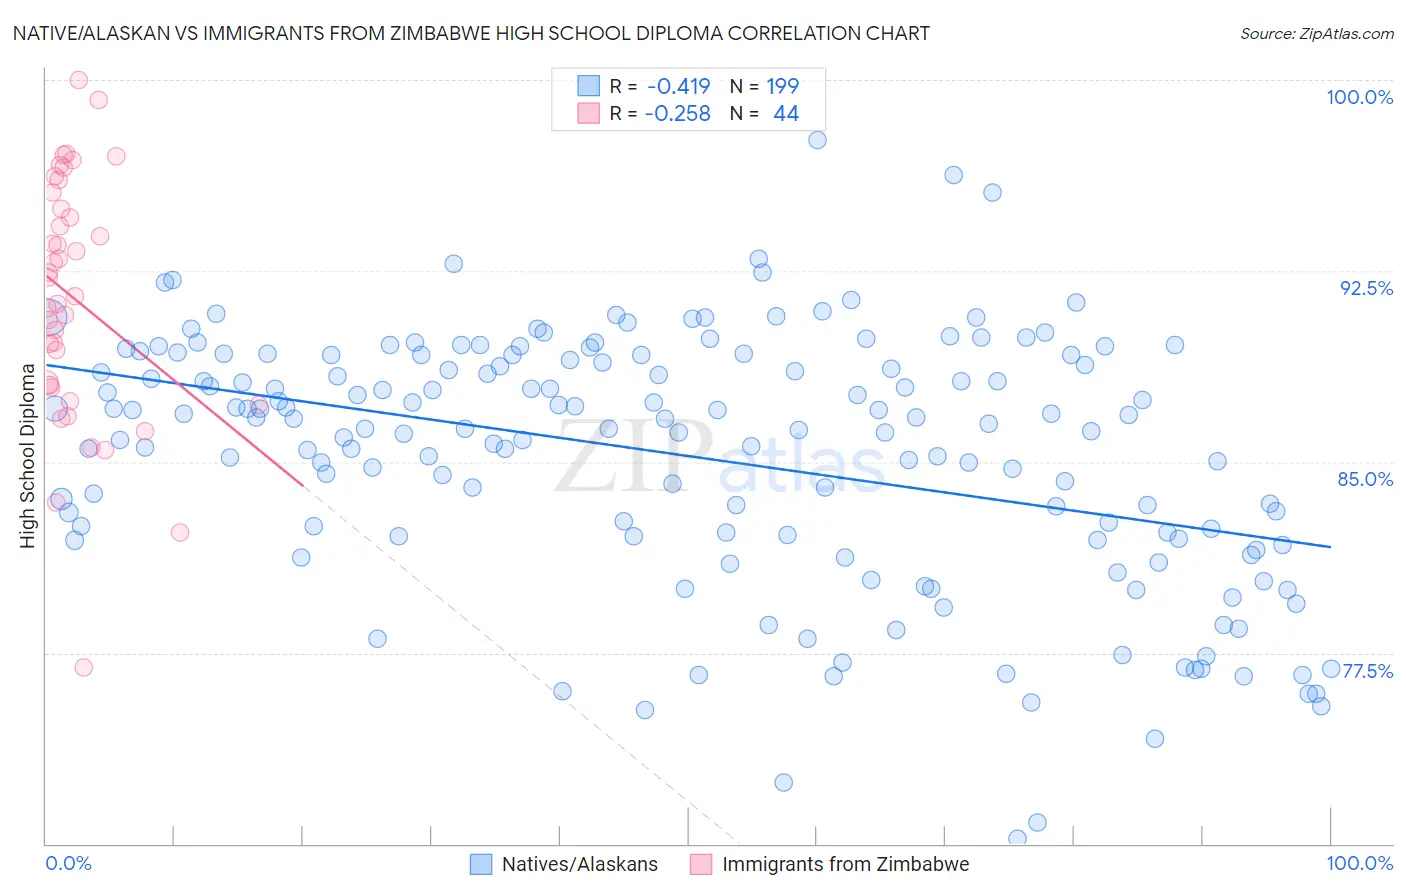
Native/Alaskan vs Immigrants from Zimbabwe High School Diploma Correlation Chart
The statistical analysis conducted on geographies consisting of 513,075,731 people shows a moderate negative correlation between the proportion of Natives/Alaskans and percentage of population with at least high school diploma education in the United States with a correlation coefficient (R) of -0.419 and weighted average of 85.6%. Similarly, the statistical analysis conducted on geographies consisting of 117,809,864 people shows a weak negative correlation between the proportion of Immigrants from Zimbabwe and percentage of population with at least high school diploma education in the United States with a correlation coefficient (R) of -0.258 and weighted average of 90.3%, a difference of 5.5%.
High School Diploma Correlation Summary
| Measurement | Native/Alaskan | Immigrants from Zimbabwe |
| Minimum | 70.2% | 76.9% |
| Maximum | 97.6% | 100.0% |
| Range | 27.5% | 23.1% |
| Mean | 85.2% | 91.4% |
| Median | 86.3% | 91.9% |
| Interquartile 25% (IQ1) | 82.1% | 88.0% |
| Interquartile 75% (IQ3) | 89.2% | 95.3% |
| Interquartile Range (IQR) | 7.1% | 7.3% |
| Standard Deviation (Sample) | 5.0% | 4.8% |
| Standard Deviation (Population) | 4.9% | 4.8% |
Similar Demographics by High School Diploma
Demographics Similar to Natives/Alaskans by High School Diploma
In terms of high school diploma, the demographic groups most similar to Natives/Alaskans are Immigrants from Grenada (85.6%, a difference of 0.020%), Immigrants from Cambodia (85.6%, a difference of 0.090%), Guyanese (85.5%, a difference of 0.10%), Immigrants from Bangladesh (85.5%, a difference of 0.12%), and Vietnamese (85.4%, a difference of 0.14%).
| Demographics | Rating | Rank | High School Diploma |
| Haitians | 0.0 /100 | #291 | Tragic 85.9% |
| Japanese | 0.0 /100 | #292 | Tragic 85.9% |
| British West Indians | 0.0 /100 | #293 | Tragic 85.9% |
| Immigrants | Fiji | 0.0 /100 | #294 | Tragic 85.8% |
| Immigrants | Immigrants | 0.0 /100 | #295 | Tragic 85.8% |
| Immigrants | Cambodia | 0.0 /100 | #296 | Tragic 85.6% |
| Immigrants | Grenada | 0.0 /100 | #297 | Tragic 85.6% |
| Natives/Alaskans | 0.0 /100 | #298 | Tragic 85.6% |
| Guyanese | 0.0 /100 | #299 | Tragic 85.5% |
| Immigrants | Bangladesh | 0.0 /100 | #300 | Tragic 85.5% |
| Vietnamese | 0.0 /100 | #301 | Tragic 85.4% |
| Immigrants | Haiti | 0.0 /100 | #302 | Tragic 85.4% |
| Cubans | 0.0 /100 | #303 | Tragic 85.4% |
| Nepalese | 0.0 /100 | #304 | Tragic 85.3% |
| Immigrants | Portugal | 0.0 /100 | #305 | Tragic 85.3% |
Demographics Similar to Immigrants from Zimbabwe by High School Diploma
In terms of high school diploma, the demographic groups most similar to Immigrants from Zimbabwe are Palestinian (90.3%, a difference of 0.0%), Immigrants from Greece (90.3%, a difference of 0.010%), Menominee (90.3%, a difference of 0.010%), Immigrants from Russia (90.3%, a difference of 0.020%), and Syrian (90.3%, a difference of 0.030%).
| Demographics | Rating | Rank | High School Diploma |
| Aleuts | 98.0 /100 | #102 | Exceptional 90.4% |
| Immigrants | Romania | 97.8 /100 | #103 | Exceptional 90.4% |
| Immigrants | Croatia | 97.8 /100 | #104 | Exceptional 90.4% |
| Lebanese | 97.4 /100 | #105 | Exceptional 90.4% |
| Syrians | 97.0 /100 | #106 | Exceptional 90.3% |
| Immigrants | Russia | 96.9 /100 | #107 | Exceptional 90.3% |
| Palestinians | 96.7 /100 | #108 | Exceptional 90.3% |
| Immigrants | Zimbabwe | 96.7 /100 | #109 | Exceptional 90.3% |
| Immigrants | Greece | 96.6 /100 | #110 | Exceptional 90.3% |
| Menominee | 96.6 /100 | #111 | Exceptional 90.3% |
| Immigrants | Belarus | 96.4 /100 | #112 | Exceptional 90.2% |
| Immigrants | Sri Lanka | 96.3 /100 | #113 | Exceptional 90.2% |
| Yugoslavians | 96.2 /100 | #114 | Exceptional 90.2% |
| Immigrants | Hungary | 95.8 /100 | #115 | Exceptional 90.2% |
| Immigrants | Germany | 95.7 /100 | #116 | Exceptional 90.2% |