Native/Alaskan vs Immigrants from Nigeria High School Diploma
COMPARE
Native/Alaskan
Immigrants from Nigeria
High School Diploma
High School Diploma Comparison
Natives/Alaskans
Immigrants from Nigeria
85.6%
HIGH SCHOOL DIPLOMA
0.0/ 100
METRIC RATING
298th/ 347
METRIC RANK
87.7%
HIGH SCHOOL DIPLOMA
1.5/ 100
METRIC RATING
250th/ 347
METRIC RANK
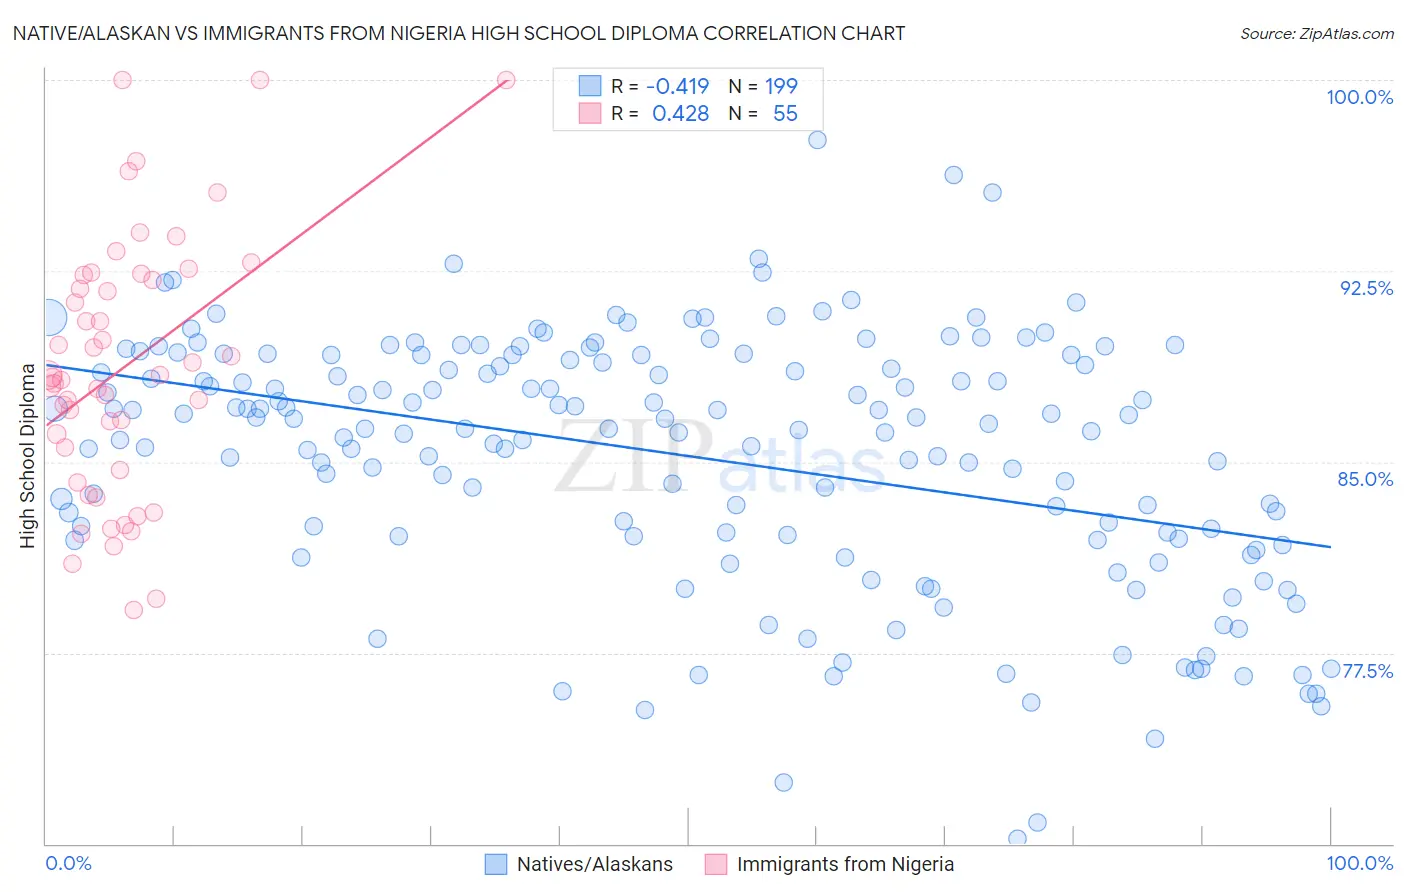
Native/Alaskan vs Immigrants from Nigeria High School Diploma Correlation Chart
The statistical analysis conducted on geographies consisting of 513,075,731 people shows a moderate negative correlation between the proportion of Natives/Alaskans and percentage of population with at least high school diploma education in the United States with a correlation coefficient (R) of -0.419 and weighted average of 85.6%. Similarly, the statistical analysis conducted on geographies consisting of 283,441,873 people shows a moderate positive correlation between the proportion of Immigrants from Nigeria and percentage of population with at least high school diploma education in the United States with a correlation coefficient (R) of 0.428 and weighted average of 87.7%, a difference of 2.5%.
High School Diploma Correlation Summary
| Measurement | Native/Alaskan | Immigrants from Nigeria |
| Minimum | 70.2% | 79.2% |
| Maximum | 97.6% | 100.0% |
| Range | 27.5% | 20.8% |
| Mean | 85.2% | 88.7% |
| Median | 86.3% | 88.3% |
| Interquartile 25% (IQ1) | 82.1% | 84.7% |
| Interquartile 75% (IQ3) | 89.2% | 92.3% |
| Interquartile Range (IQR) | 7.1% | 7.7% |
| Standard Deviation (Sample) | 5.0% | 5.1% |
| Standard Deviation (Population) | 4.9% | 5.0% |
Similar Demographics by High School Diploma
Demographics Similar to Natives/Alaskans by High School Diploma
In terms of high school diploma, the demographic groups most similar to Natives/Alaskans are Immigrants from Grenada (85.6%, a difference of 0.020%), Immigrants from Cambodia (85.6%, a difference of 0.090%), Guyanese (85.5%, a difference of 0.10%), Immigrants from Bangladesh (85.5%, a difference of 0.12%), and Vietnamese (85.4%, a difference of 0.14%).
| Demographics | Rating | Rank | High School Diploma |
| Haitians | 0.0 /100 | #291 | Tragic 85.9% |
| Japanese | 0.0 /100 | #292 | Tragic 85.9% |
| British West Indians | 0.0 /100 | #293 | Tragic 85.9% |
| Immigrants | Fiji | 0.0 /100 | #294 | Tragic 85.8% |
| Immigrants | Immigrants | 0.0 /100 | #295 | Tragic 85.8% |
| Immigrants | Cambodia | 0.0 /100 | #296 | Tragic 85.6% |
| Immigrants | Grenada | 0.0 /100 | #297 | Tragic 85.6% |
| Natives/Alaskans | 0.0 /100 | #298 | Tragic 85.6% |
| Guyanese | 0.0 /100 | #299 | Tragic 85.5% |
| Immigrants | Bangladesh | 0.0 /100 | #300 | Tragic 85.5% |
| Vietnamese | 0.0 /100 | #301 | Tragic 85.4% |
| Immigrants | Haiti | 0.0 /100 | #302 | Tragic 85.4% |
| Cubans | 0.0 /100 | #303 | Tragic 85.4% |
| Nepalese | 0.0 /100 | #304 | Tragic 85.3% |
| Immigrants | Portugal | 0.0 /100 | #305 | Tragic 85.3% |
Demographics Similar to Immigrants from Nigeria by High School Diploma
In terms of high school diploma, the demographic groups most similar to Immigrants from Nigeria are Senegalese (87.7%, a difference of 0.0%), Spanish American (87.7%, a difference of 0.010%), Ghanaian (87.7%, a difference of 0.040%), Immigrants from Eritrea (87.8%, a difference of 0.050%), and Immigrants from Costa Rica (87.8%, a difference of 0.050%).
| Demographics | Rating | Rank | High School Diploma |
| Immigrants | Philippines | 1.9 /100 | #243 | Tragic 87.8% |
| Choctaw | 1.9 /100 | #244 | Tragic 87.8% |
| Peruvians | 1.9 /100 | #245 | Tragic 87.8% |
| Immigrants | Eritrea | 1.7 /100 | #246 | Tragic 87.8% |
| Immigrants | Costa Rica | 1.7 /100 | #247 | Tragic 87.8% |
| Spanish Americans | 1.5 /100 | #248 | Tragic 87.7% |
| Senegalese | 1.5 /100 | #249 | Tragic 87.7% |
| Immigrants | Nigeria | 1.5 /100 | #250 | Tragic 87.7% |
| Ghanaians | 1.4 /100 | #251 | Tragic 87.7% |
| Immigrants | South America | 1.2 /100 | #252 | Tragic 87.6% |
| Immigrants | Uruguay | 1.0 /100 | #253 | Tragic 87.6% |
| Immigrants | Colombia | 1.0 /100 | #254 | Tragic 87.6% |
| Immigrants | Senegal | 0.9 /100 | #255 | Tragic 87.6% |
| Africans | 0.7 /100 | #256 | Tragic 87.5% |
| Bahamians | 0.7 /100 | #257 | Tragic 87.5% |