Apache vs Immigrants from Nigeria High School Diploma
COMPARE
Apache
Immigrants from Nigeria
High School Diploma
High School Diploma Comparison
Apache
Immigrants from Nigeria
85.1%
HIGH SCHOOL DIPLOMA
0.0/ 100
METRIC RATING
310th/ 347
METRIC RANK
87.7%
HIGH SCHOOL DIPLOMA
1.5/ 100
METRIC RATING
250th/ 347
METRIC RANK
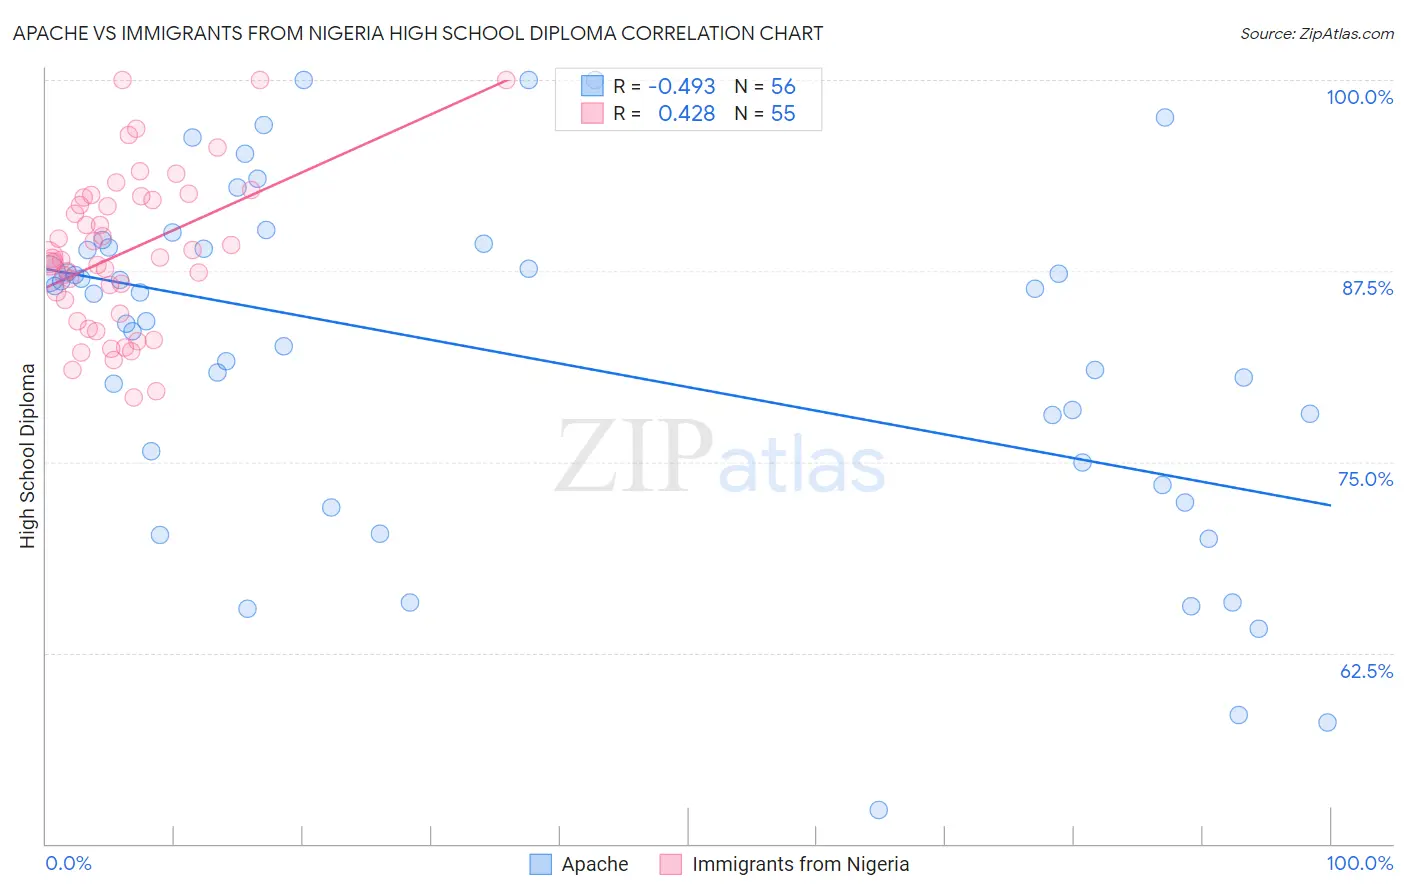
Apache vs Immigrants from Nigeria High School Diploma Correlation Chart
The statistical analysis conducted on geographies consisting of 231,143,094 people shows a moderate negative correlation between the proportion of Apache and percentage of population with at least high school diploma education in the United States with a correlation coefficient (R) of -0.493 and weighted average of 85.1%. Similarly, the statistical analysis conducted on geographies consisting of 283,441,873 people shows a moderate positive correlation between the proportion of Immigrants from Nigeria and percentage of population with at least high school diploma education in the United States with a correlation coefficient (R) of 0.428 and weighted average of 87.7%, a difference of 3.1%.
High School Diploma Correlation Summary
| Measurement | Apache | Immigrants from Nigeria |
| Minimum | 52.2% | 79.2% |
| Maximum | 100.0% | 100.0% |
| Range | 47.8% | 20.8% |
| Mean | 81.9% | 88.7% |
| Median | 85.1% | 88.3% |
| Interquartile 25% (IQ1) | 74.2% | 84.7% |
| Interquartile 75% (IQ3) | 89.0% | 92.3% |
| Interquartile Range (IQR) | 14.8% | 7.7% |
| Standard Deviation (Sample) | 11.3% | 5.1% |
| Standard Deviation (Population) | 11.2% | 5.0% |
Similar Demographics by High School Diploma
Demographics Similar to Apache by High School Diploma
In terms of high school diploma, the demographic groups most similar to Apache are Ecuadorian (85.1%, a difference of 0.010%), Cape Verdean (85.1%, a difference of 0.060%), Immigrants from Dominica (85.2%, a difference of 0.080%), Immigrants from Armenia (85.2%, a difference of 0.090%), and Navajo (85.2%, a difference of 0.10%).
| Demographics | Rating | Rank | High School Diploma |
| Cubans | 0.0 /100 | #303 | Tragic 85.4% |
| Nepalese | 0.0 /100 | #304 | Tragic 85.3% |
| Immigrants | Portugal | 0.0 /100 | #305 | Tragic 85.3% |
| Immigrants | Guyana | 0.0 /100 | #306 | Tragic 85.3% |
| Navajo | 0.0 /100 | #307 | Tragic 85.2% |
| Immigrants | Armenia | 0.0 /100 | #308 | Tragic 85.2% |
| Immigrants | Dominica | 0.0 /100 | #309 | Tragic 85.2% |
| Apache | 0.0 /100 | #310 | Tragic 85.1% |
| Ecuadorians | 0.0 /100 | #311 | Tragic 85.1% |
| Cape Verdeans | 0.0 /100 | #312 | Tragic 85.1% |
| Immigrants | Ecuador | 0.0 /100 | #313 | Tragic 84.8% |
| Yaqui | 0.0 /100 | #314 | Tragic 84.7% |
| Puerto Ricans | 0.0 /100 | #315 | Tragic 84.7% |
| Belizeans | 0.0 /100 | #316 | Tragic 84.3% |
| Immigrants | Caribbean | 0.0 /100 | #317 | Tragic 84.3% |
Demographics Similar to Immigrants from Nigeria by High School Diploma
In terms of high school diploma, the demographic groups most similar to Immigrants from Nigeria are Senegalese (87.7%, a difference of 0.0%), Spanish American (87.7%, a difference of 0.010%), Ghanaian (87.7%, a difference of 0.040%), Immigrants from Eritrea (87.8%, a difference of 0.050%), and Immigrants from Costa Rica (87.8%, a difference of 0.050%).
| Demographics | Rating | Rank | High School Diploma |
| Immigrants | Philippines | 1.9 /100 | #243 | Tragic 87.8% |
| Choctaw | 1.9 /100 | #244 | Tragic 87.8% |
| Peruvians | 1.9 /100 | #245 | Tragic 87.8% |
| Immigrants | Eritrea | 1.7 /100 | #246 | Tragic 87.8% |
| Immigrants | Costa Rica | 1.7 /100 | #247 | Tragic 87.8% |
| Spanish Americans | 1.5 /100 | #248 | Tragic 87.7% |
| Senegalese | 1.5 /100 | #249 | Tragic 87.7% |
| Immigrants | Nigeria | 1.5 /100 | #250 | Tragic 87.7% |
| Ghanaians | 1.4 /100 | #251 | Tragic 87.7% |
| Immigrants | South America | 1.2 /100 | #252 | Tragic 87.6% |
| Immigrants | Uruguay | 1.0 /100 | #253 | Tragic 87.6% |
| Immigrants | Colombia | 1.0 /100 | #254 | Tragic 87.6% |
| Immigrants | Senegal | 0.9 /100 | #255 | Tragic 87.6% |
| Africans | 0.7 /100 | #256 | Tragic 87.5% |
| Bahamians | 0.7 /100 | #257 | Tragic 87.5% |