Maltese vs Immigrants from Oceania Master's Degree
COMPARE
Maltese
Immigrants from Oceania
Master's Degree
Master's Degree Comparison
Maltese
Immigrants from Oceania
17.3%
MASTER'S DEGREE
99.3/ 100
METRIC RATING
87th/ 347
METRIC RANK
14.7%
MASTER'S DEGREE
37.1/ 100
METRIC RATING
186th/ 347
METRIC RANK
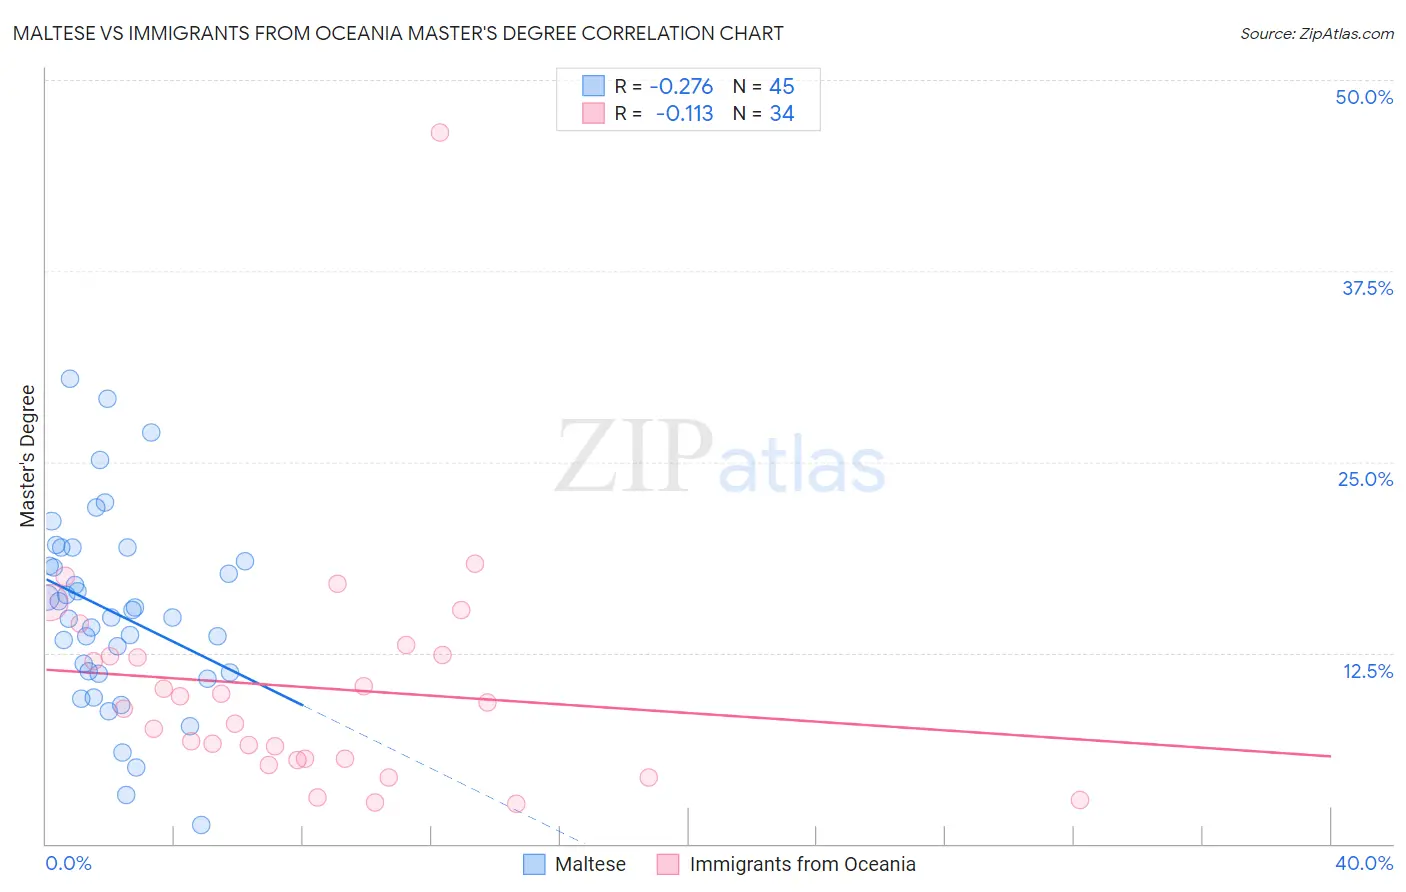
Maltese vs Immigrants from Oceania Master's Degree Correlation Chart
The statistical analysis conducted on geographies consisting of 126,460,442 people shows a weak negative correlation between the proportion of Maltese and percentage of population with at least master's degree education in the United States with a correlation coefficient (R) of -0.276 and weighted average of 17.3%. Similarly, the statistical analysis conducted on geographies consisting of 305,448,765 people shows a poor negative correlation between the proportion of Immigrants from Oceania and percentage of population with at least master's degree education in the United States with a correlation coefficient (R) of -0.113 and weighted average of 14.7%, a difference of 17.7%.
Master's Degree Correlation Summary
| Measurement | Maltese | Immigrants from Oceania |
| Minimum | 1.2% | 2.6% |
| Maximum | 30.4% | 46.6% |
| Range | 29.2% | 44.0% |
| Mean | 15.1% | 10.2% |
| Median | 14.8% | 9.0% |
| Interquartile 25% (IQ1) | 11.1% | 5.6% |
| Interquartile 75% (IQ3) | 18.9% | 12.3% |
| Interquartile Range (IQR) | 7.8% | 6.8% |
| Standard Deviation (Sample) | 6.3% | 7.9% |
| Standard Deviation (Population) | 6.2% | 7.7% |
Similar Demographics by Master's Degree
Demographics Similar to Maltese by Master's Degree
In terms of master's degree, the demographic groups most similar to Maltese are Immigrants from Croatia (17.3%, a difference of 0.10%), Immigrants from Canada (17.2%, a difference of 0.36%), Bhutanese (17.2%, a difference of 0.43%), Immigrants from Egypt (17.2%, a difference of 0.45%), and Immigrants from Brazil (17.4%, a difference of 0.51%).
| Demographics | Rating | Rank | Master's Degree |
| Carpatho Rusyns | 99.6 /100 | #80 | Exceptional 17.5% |
| Immigrants | Western Asia | 99.5 /100 | #81 | Exceptional 17.5% |
| Greeks | 99.5 /100 | #82 | Exceptional 17.5% |
| Immigrants | Zimbabwe | 99.5 /100 | #83 | Exceptional 17.4% |
| Immigrants | Scotland | 99.4 /100 | #84 | Exceptional 17.4% |
| Immigrants | Brazil | 99.4 /100 | #85 | Exceptional 17.4% |
| Immigrants | Croatia | 99.3 /100 | #86 | Exceptional 17.3% |
| Maltese | 99.3 /100 | #87 | Exceptional 17.3% |
| Immigrants | Canada | 99.2 /100 | #88 | Exceptional 17.2% |
| Bhutanese | 99.1 /100 | #89 | Exceptional 17.2% |
| Immigrants | Egypt | 99.1 /100 | #90 | Exceptional 17.2% |
| Romanians | 99.1 /100 | #91 | Exceptional 17.2% |
| Immigrants | North America | 99.1 /100 | #92 | Exceptional 17.2% |
| Immigrants | Italy | 99.1 /100 | #93 | Exceptional 17.2% |
| Ugandans | 99.0 /100 | #94 | Exceptional 17.1% |
Demographics Similar to Immigrants from Oceania by Master's Degree
In terms of master's degree, the demographic groups most similar to Immigrants from Oceania are Basque (14.7%, a difference of 0.080%), Immigrants from Costa Rica (14.7%, a difference of 0.12%), Barbadian (14.7%, a difference of 0.16%), Immigrants (14.6%, a difference of 0.16%), and Spaniard (14.6%, a difference of 0.19%).
| Demographics | Rating | Rank | Master's Degree |
| Immigrants | Iraq | 41.3 /100 | #179 | Average 14.8% |
| Celtics | 41.3 /100 | #180 | Average 14.8% |
| Swiss | 41.1 /100 | #181 | Average 14.7% |
| Czechs | 40.4 /100 | #182 | Average 14.7% |
| Sri Lankans | 39.6 /100 | #183 | Fair 14.7% |
| Immigrants | Zaire | 39.5 /100 | #184 | Fair 14.7% |
| Barbadians | 38.3 /100 | #185 | Fair 14.7% |
| Immigrants | Oceania | 37.1 /100 | #186 | Fair 14.7% |
| Basques | 36.5 /100 | #187 | Fair 14.7% |
| Immigrants | Costa Rica | 36.2 /100 | #188 | Fair 14.7% |
| Immigrants | Immigrants | 36.0 /100 | #189 | Fair 14.6% |
| Spaniards | 35.8 /100 | #190 | Fair 14.6% |
| Welsh | 34.2 /100 | #191 | Fair 14.6% |
| Immigrants | Middle Africa | 33.6 /100 | #192 | Fair 14.6% |
| Immigrants | Nigeria | 32.7 /100 | #193 | Fair 14.6% |