Barbadian vs Immigrants from Oceania Master's Degree
COMPARE
Barbadian
Immigrants from Oceania
Master's Degree
Master's Degree Comparison
Barbadians
Immigrants from Oceania
14.7%
MASTER'S DEGREE
38.3/ 100
METRIC RATING
185th/ 347
METRIC RANK
14.7%
MASTER'S DEGREE
37.1/ 100
METRIC RATING
186th/ 347
METRIC RANK
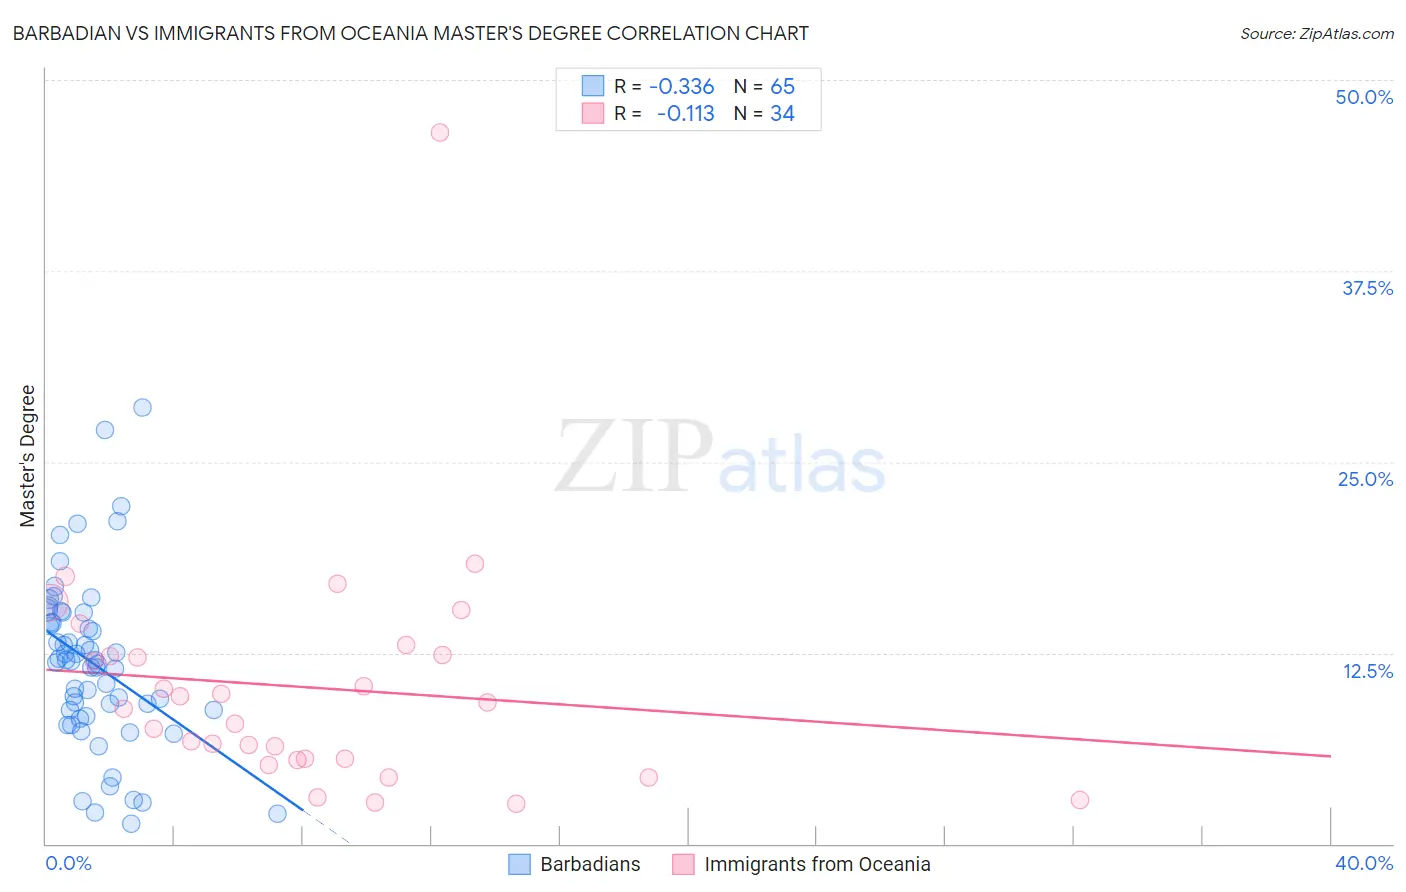
Barbadian vs Immigrants from Oceania Master's Degree Correlation Chart
The statistical analysis conducted on geographies consisting of 141,295,257 people shows a mild negative correlation between the proportion of Barbadians and percentage of population with at least master's degree education in the United States with a correlation coefficient (R) of -0.336 and weighted average of 14.7%. Similarly, the statistical analysis conducted on geographies consisting of 305,448,765 people shows a poor negative correlation between the proportion of Immigrants from Oceania and percentage of population with at least master's degree education in the United States with a correlation coefficient (R) of -0.113 and weighted average of 14.7%, a difference of 0.16%.
Master's Degree Correlation Summary
| Measurement | Barbadian | Immigrants from Oceania |
| Minimum | 1.3% | 2.6% |
| Maximum | 28.6% | 46.6% |
| Range | 27.2% | 44.0% |
| Mean | 11.8% | 10.2% |
| Median | 12.0% | 9.0% |
| Interquartile 25% (IQ1) | 8.6% | 5.6% |
| Interquartile 75% (IQ3) | 14.8% | 12.3% |
| Interquartile Range (IQR) | 6.3% | 6.8% |
| Standard Deviation (Sample) | 5.5% | 7.9% |
| Standard Deviation (Population) | 5.5% | 7.7% |
Demographics Similar to Barbadians and Immigrants from Oceania by Master's Degree
In terms of master's degree, the demographic groups most similar to Barbadians are Immigrants from Zaire (14.7%, a difference of 0.16%), Sri Lankan (14.7%, a difference of 0.18%), Basque (14.7%, a difference of 0.24%), Czech (14.7%, a difference of 0.28%), and Immigrants from Costa Rica (14.7%, a difference of 0.29%). Similarly, the demographic groups most similar to Immigrants from Oceania are Basque (14.7%, a difference of 0.080%), Immigrants from Costa Rica (14.7%, a difference of 0.12%), Immigrants (14.6%, a difference of 0.16%), Spaniard (14.6%, a difference of 0.19%), and Immigrants from Zaire (14.7%, a difference of 0.32%).
| Demographics | Rating | Rank | Master's Degree |
| Immigrants | Peru | 49.6 /100 | #175 | Average 14.9% |
| Nigerians | 48.6 /100 | #176 | Average 14.9% |
| Immigrants | Colombia | 48.3 /100 | #177 | Average 14.9% |
| English | 45.0 /100 | #178 | Average 14.8% |
| Immigrants | Iraq | 41.3 /100 | #179 | Average 14.8% |
| Celtics | 41.3 /100 | #180 | Average 14.8% |
| Swiss | 41.1 /100 | #181 | Average 14.7% |
| Czechs | 40.4 /100 | #182 | Average 14.7% |
| Sri Lankans | 39.6 /100 | #183 | Fair 14.7% |
| Immigrants | Zaire | 39.5 /100 | #184 | Fair 14.7% |
| Barbadians | 38.3 /100 | #185 | Fair 14.7% |
| Immigrants | Oceania | 37.1 /100 | #186 | Fair 14.7% |
| Basques | 36.5 /100 | #187 | Fair 14.7% |
| Immigrants | Costa Rica | 36.2 /100 | #188 | Fair 14.7% |
| Immigrants | Immigrants | 36.0 /100 | #189 | Fair 14.6% |
| Spaniards | 35.8 /100 | #190 | Fair 14.6% |
| Welsh | 34.2 /100 | #191 | Fair 14.6% |
| Immigrants | Middle Africa | 33.6 /100 | #192 | Fair 14.6% |
| Immigrants | Nigeria | 32.7 /100 | #193 | Fair 14.6% |
| Chinese | 32.5 /100 | #194 | Fair 14.6% |
| Danes | 31.3 /100 | #195 | Fair 14.5% |