Korean vs Immigrants from Oceania Master's Degree
COMPARE
Korean
Immigrants from Oceania
Master's Degree
Master's Degree Comparison
Koreans
Immigrants from Oceania
14.0%
MASTER'S DEGREE
12.7/ 100
METRIC RATING
221st/ 347
METRIC RANK
14.7%
MASTER'S DEGREE
37.1/ 100
METRIC RATING
186th/ 347
METRIC RANK
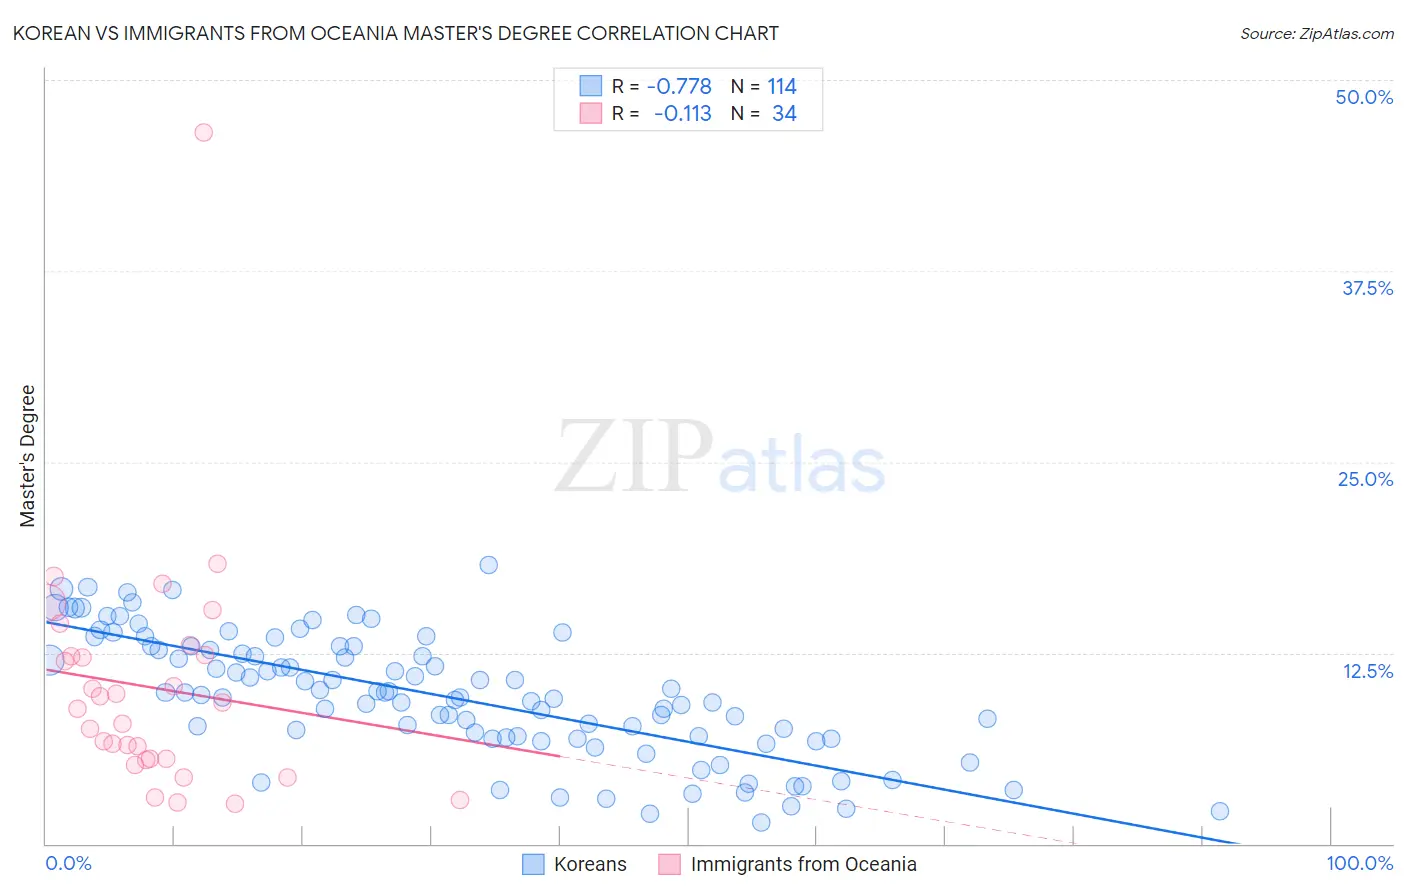
Korean vs Immigrants from Oceania Master's Degree Correlation Chart
The statistical analysis conducted on geographies consisting of 510,607,877 people shows a strong negative correlation between the proportion of Koreans and percentage of population with at least master's degree education in the United States with a correlation coefficient (R) of -0.778 and weighted average of 14.0%. Similarly, the statistical analysis conducted on geographies consisting of 305,448,765 people shows a poor negative correlation between the proportion of Immigrants from Oceania and percentage of population with at least master's degree education in the United States with a correlation coefficient (R) of -0.113 and weighted average of 14.7%, a difference of 4.8%.
Master's Degree Correlation Summary
| Measurement | Korean | Immigrants from Oceania |
| Minimum | 1.4% | 2.6% |
| Maximum | 18.3% | 46.6% |
| Range | 16.9% | 44.0% |
| Mean | 9.7% | 10.2% |
| Median | 9.8% | 9.0% |
| Interquartile 25% (IQ1) | 6.9% | 5.6% |
| Interquartile 75% (IQ3) | 12.9% | 12.3% |
| Interquartile Range (IQR) | 6.0% | 6.8% |
| Standard Deviation (Sample) | 4.0% | 7.9% |
| Standard Deviation (Population) | 4.0% | 7.7% |
Similar Demographics by Master's Degree
Demographics Similar to Koreans by Master's Degree
In terms of master's degree, the demographic groups most similar to Koreans are Ecuadorian (14.0%, a difference of 0.030%), German (14.0%, a difference of 0.13%), Immigrants from South Eastern Asia (14.0%, a difference of 0.23%), Immigrants from Grenada (14.0%, a difference of 0.28%), and Norwegian (14.0%, a difference of 0.29%).
| Demographics | Rating | Rank | Master's Degree |
| Finns | 16.9 /100 | #214 | Poor 14.2% |
| Immigrants | Vietnam | 16.1 /100 | #215 | Poor 14.1% |
| Immigrants | Somalia | 15.8 /100 | #216 | Poor 14.1% |
| Immigrants | Trinidad and Tobago | 15.8 /100 | #217 | Poor 14.1% |
| French Canadians | 14.9 /100 | #218 | Poor 14.1% |
| Norwegians | 13.6 /100 | #219 | Poor 14.0% |
| Germans | 13.1 /100 | #220 | Poor 14.0% |
| Koreans | 12.7 /100 | #221 | Poor 14.0% |
| Ecuadorians | 12.6 /100 | #222 | Poor 14.0% |
| Immigrants | South Eastern Asia | 11.9 /100 | #223 | Poor 14.0% |
| Immigrants | Grenada | 11.8 /100 | #224 | Poor 14.0% |
| Portuguese | 11.2 /100 | #225 | Poor 13.9% |
| Immigrants | St. Vincent and the Grenadines | 11.0 /100 | #226 | Poor 13.9% |
| Immigrants | West Indies | 9.8 /100 | #227 | Tragic 13.9% |
| Whites/Caucasians | 9.1 /100 | #228 | Tragic 13.8% |
Demographics Similar to Immigrants from Oceania by Master's Degree
In terms of master's degree, the demographic groups most similar to Immigrants from Oceania are Basque (14.7%, a difference of 0.080%), Immigrants from Costa Rica (14.7%, a difference of 0.12%), Barbadian (14.7%, a difference of 0.16%), Immigrants (14.6%, a difference of 0.16%), and Spaniard (14.6%, a difference of 0.19%).
| Demographics | Rating | Rank | Master's Degree |
| Immigrants | Iraq | 41.3 /100 | #179 | Average 14.8% |
| Celtics | 41.3 /100 | #180 | Average 14.8% |
| Swiss | 41.1 /100 | #181 | Average 14.7% |
| Czechs | 40.4 /100 | #182 | Average 14.7% |
| Sri Lankans | 39.6 /100 | #183 | Fair 14.7% |
| Immigrants | Zaire | 39.5 /100 | #184 | Fair 14.7% |
| Barbadians | 38.3 /100 | #185 | Fair 14.7% |
| Immigrants | Oceania | 37.1 /100 | #186 | Fair 14.7% |
| Basques | 36.5 /100 | #187 | Fair 14.7% |
| Immigrants | Costa Rica | 36.2 /100 | #188 | Fair 14.7% |
| Immigrants | Immigrants | 36.0 /100 | #189 | Fair 14.6% |
| Spaniards | 35.8 /100 | #190 | Fair 14.6% |
| Welsh | 34.2 /100 | #191 | Fair 14.6% |
| Immigrants | Middle Africa | 33.6 /100 | #192 | Fair 14.6% |
| Immigrants | Nigeria | 32.7 /100 | #193 | Fair 14.6% |