Lumbee vs Fijian College, 1 year or more
COMPARE
Lumbee
Fijian
College, 1 year or more
College, 1 year or more Comparison
Lumbee
Fijians
48.9%
COLLEGE, 1 YEAR OR MORE
0.0/ 100
METRIC RATING
334th/ 347
METRIC RANK
51.3%
COLLEGE, 1 YEAR OR MORE
0.0/ 100
METRIC RATING
314th/ 347
METRIC RANK
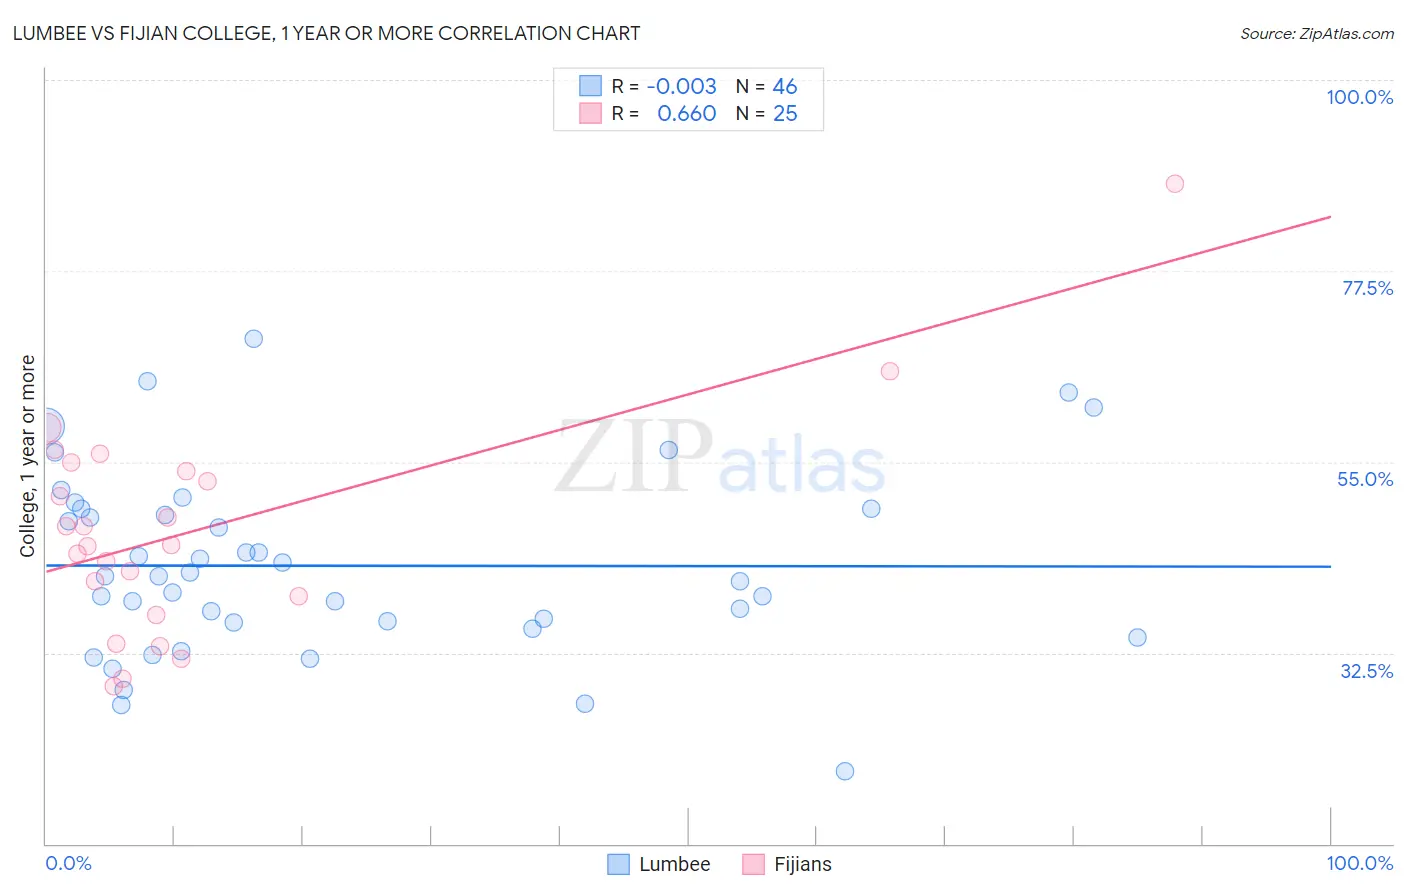
Lumbee vs Fijian College, 1 year or more Correlation Chart
The statistical analysis conducted on geographies consisting of 92,299,068 people shows no correlation between the proportion of Lumbee and percentage of population with at least college, 1 year or more education in the United States with a correlation coefficient (R) of -0.003 and weighted average of 48.9%. Similarly, the statistical analysis conducted on geographies consisting of 55,948,842 people shows a significant positive correlation between the proportion of Fijians and percentage of population with at least college, 1 year or more education in the United States with a correlation coefficient (R) of 0.660 and weighted average of 51.3%, a difference of 5.0%.
College, 1 year or more Correlation Summary
| Measurement | Lumbee | Fijian |
| Minimum | 18.5% | 28.6% |
| Maximum | 69.5% | 87.8% |
| Range | 51.0% | 59.3% |
| Mean | 42.8% | 47.0% |
| Median | 41.5% | 45.2% |
| Interquartile 25% (IQ1) | 36.0% | 38.0% |
| Interquartile 75% (IQ3) | 49.4% | 54.4% |
| Interquartile Range (IQR) | 13.4% | 16.4% |
| Standard Deviation (Sample) | 10.9% | 12.9% |
| Standard Deviation (Population) | 10.8% | 12.6% |
Demographics Similar to Lumbee and Fijians by College, 1 year or more
In terms of college, 1 year or more, the demographic groups most similar to Lumbee are Immigrants from Dominican Republic (49.1%, a difference of 0.58%), Mexican (49.2%, a difference of 0.75%), Immigrants from Yemen (50.0%, a difference of 2.4%), Native/Alaskan (50.2%, a difference of 2.8%), and Cape Verdean (50.3%, a difference of 3.0%). Similarly, the demographic groups most similar to Fijians are Guatemalan (51.2%, a difference of 0.23%), Cajun (51.2%, a difference of 0.30%), Hispanic or Latino (51.1%, a difference of 0.39%), Immigrants from Honduras (51.0%, a difference of 0.52%), and Immigrants from El Salvador (51.0%, a difference of 0.61%).
| Demographics | Rating | Rank | College, 1 year or more |
| Fijians | 0.0 /100 | #314 | Tragic 51.3% |
| Guatemalans | 0.0 /100 | #315 | Tragic 51.2% |
| Cajuns | 0.0 /100 | #316 | Tragic 51.2% |
| Hispanics or Latinos | 0.0 /100 | #317 | Tragic 51.1% |
| Immigrants | Honduras | 0.0 /100 | #318 | Tragic 51.0% |
| Immigrants | El Salvador | 0.0 /100 | #319 | Tragic 51.0% |
| Kiowa | 0.0 /100 | #320 | Tragic 51.0% |
| Hopi | 0.0 /100 | #321 | Tragic 50.9% |
| Navajo | 0.0 /100 | #322 | Tragic 50.8% |
| Immigrants | Guatemala | 0.0 /100 | #323 | Tragic 50.7% |
| Immigrants | Cuba | 0.0 /100 | #324 | Tragic 50.7% |
| Immigrants | Latin America | 0.0 /100 | #325 | Tragic 50.7% |
| Dominicans | 0.0 /100 | #326 | Tragic 50.6% |
| Menominee | 0.0 /100 | #327 | Tragic 50.6% |
| Dutch West Indians | 0.0 /100 | #328 | Tragic 50.5% |
| Cape Verdeans | 0.0 /100 | #329 | Tragic 50.3% |
| Natives/Alaskans | 0.0 /100 | #330 | Tragic 50.2% |
| Immigrants | Yemen | 0.0 /100 | #331 | Tragic 50.0% |
| Mexicans | 0.0 /100 | #332 | Tragic 49.2% |
| Immigrants | Dominican Republic | 0.0 /100 | #333 | Tragic 49.1% |
| Lumbee | 0.0 /100 | #334 | Tragic 48.9% |