Lumbee vs Jamaican College, 1 year or more
COMPARE
Lumbee
Jamaican
College, 1 year or more
College, 1 year or more Comparison
Lumbee
Jamaicans
48.9%
COLLEGE, 1 YEAR OR MORE
0.0/ 100
METRIC RATING
334th/ 347
METRIC RANK
54.9%
COLLEGE, 1 YEAR OR MORE
0.3/ 100
METRIC RATING
260th/ 347
METRIC RANK
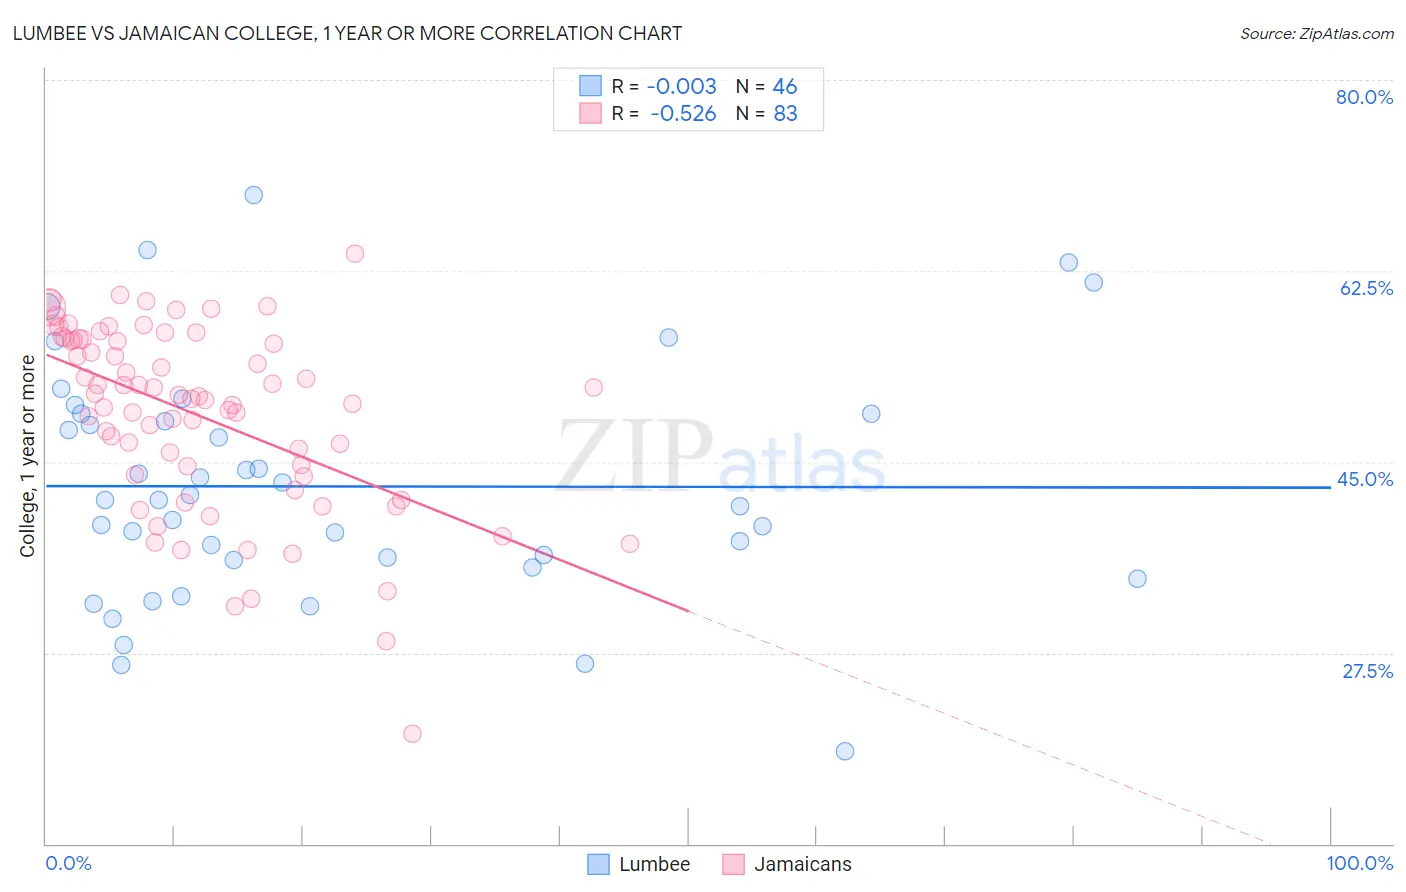
Lumbee vs Jamaican College, 1 year or more Correlation Chart
The statistical analysis conducted on geographies consisting of 92,299,068 people shows no correlation between the proportion of Lumbee and percentage of population with at least college, 1 year or more education in the United States with a correlation coefficient (R) of -0.003 and weighted average of 48.9%. Similarly, the statistical analysis conducted on geographies consisting of 368,077,485 people shows a substantial negative correlation between the proportion of Jamaicans and percentage of population with at least college, 1 year or more education in the United States with a correlation coefficient (R) of -0.526 and weighted average of 54.9%, a difference of 12.3%.
College, 1 year or more Correlation Summary
| Measurement | Lumbee | Jamaican |
| Minimum | 18.5% | 20.1% |
| Maximum | 69.5% | 64.1% |
| Range | 51.0% | 44.0% |
| Mean | 42.8% | 49.3% |
| Median | 41.5% | 51.0% |
| Interquartile 25% (IQ1) | 36.0% | 43.8% |
| Interquartile 75% (IQ3) | 49.4% | 56.2% |
| Interquartile Range (IQR) | 13.4% | 12.4% |
| Standard Deviation (Sample) | 10.9% | 8.5% |
| Standard Deviation (Population) | 10.8% | 8.4% |
Similar Demographics by College, 1 year or more
Demographics Similar to Lumbee by College, 1 year or more
In terms of college, 1 year or more, the demographic groups most similar to Lumbee are Yuman (48.7%, a difference of 0.28%), Immigrants from Dominican Republic (49.1%, a difference of 0.58%), Spanish American Indian (48.5%, a difference of 0.72%), Pennsylvania German (48.5%, a difference of 0.73%), and Mexican (49.2%, a difference of 0.75%).
| Demographics | Rating | Rank | College, 1 year or more |
| Menominee | 0.0 /100 | #327 | Tragic 50.6% |
| Dutch West Indians | 0.0 /100 | #328 | Tragic 50.5% |
| Cape Verdeans | 0.0 /100 | #329 | Tragic 50.3% |
| Natives/Alaskans | 0.0 /100 | #330 | Tragic 50.2% |
| Immigrants | Yemen | 0.0 /100 | #331 | Tragic 50.0% |
| Mexicans | 0.0 /100 | #332 | Tragic 49.2% |
| Immigrants | Dominican Republic | 0.0 /100 | #333 | Tragic 49.1% |
| Lumbee | 0.0 /100 | #334 | Tragic 48.9% |
| Yuman | 0.0 /100 | #335 | Tragic 48.7% |
| Spanish American Indians | 0.0 /100 | #336 | Tragic 48.5% |
| Pennsylvania Germans | 0.0 /100 | #337 | Tragic 48.5% |
| Immigrants | Central America | 0.0 /100 | #338 | Tragic 48.5% |
| Immigrants | Azores | 0.0 /100 | #339 | Tragic 48.4% |
| Immigrants | Cabo Verde | 0.0 /100 | #340 | Tragic 48.1% |
| Immigrants | Mexico | 0.0 /100 | #341 | Tragic 47.5% |
Demographics Similar to Jamaicans by College, 1 year or more
In terms of college, 1 year or more, the demographic groups most similar to Jamaicans are Ottawa (54.9%, a difference of 0.030%), Nepalese (54.9%, a difference of 0.10%), Immigrants from St. Vincent and the Grenadines (54.8%, a difference of 0.11%), U.S. Virgin Islander (54.8%, a difference of 0.13%), and African (55.0%, a difference of 0.16%).
| Demographics | Rating | Rank | College, 1 year or more |
| Immigrants | Barbados | 0.6 /100 | #253 | Tragic 55.4% |
| Japanese | 0.5 /100 | #254 | Tragic 55.2% |
| Immigrants | Bahamas | 0.5 /100 | #255 | Tragic 55.2% |
| Immigrants | West Indies | 0.5 /100 | #256 | Tragic 55.2% |
| Indonesians | 0.4 /100 | #257 | Tragic 55.1% |
| Africans | 0.4 /100 | #258 | Tragic 55.0% |
| Nepalese | 0.3 /100 | #259 | Tragic 54.9% |
| Jamaicans | 0.3 /100 | #260 | Tragic 54.9% |
| Ottawa | 0.3 /100 | #261 | Tragic 54.9% |
| Immigrants | St. Vincent and the Grenadines | 0.3 /100 | #262 | Tragic 54.8% |
| U.S. Virgin Islanders | 0.3 /100 | #263 | Tragic 54.8% |
| Immigrants | Micronesia | 0.3 /100 | #264 | Tragic 54.8% |
| Immigrants | Laos | 0.2 /100 | #265 | Tragic 54.7% |
| Potawatomi | 0.2 /100 | #266 | Tragic 54.6% |
| Blackfeet | 0.2 /100 | #267 | Tragic 54.6% |