Lumbee vs Fijian Single Mother Households
COMPARE
Lumbee
Fijian
Single Mother Households
Single Mother Households Comparison
Lumbee
Fijians
9.1%
SINGLE MOTHER HOUSEHOLDS
0.0/ 100
METRIC RATING
340th/ 347
METRIC RANK
7.2%
SINGLE MOTHER HOUSEHOLDS
0.6/ 100
METRIC RATING
242nd/ 347
METRIC RANK
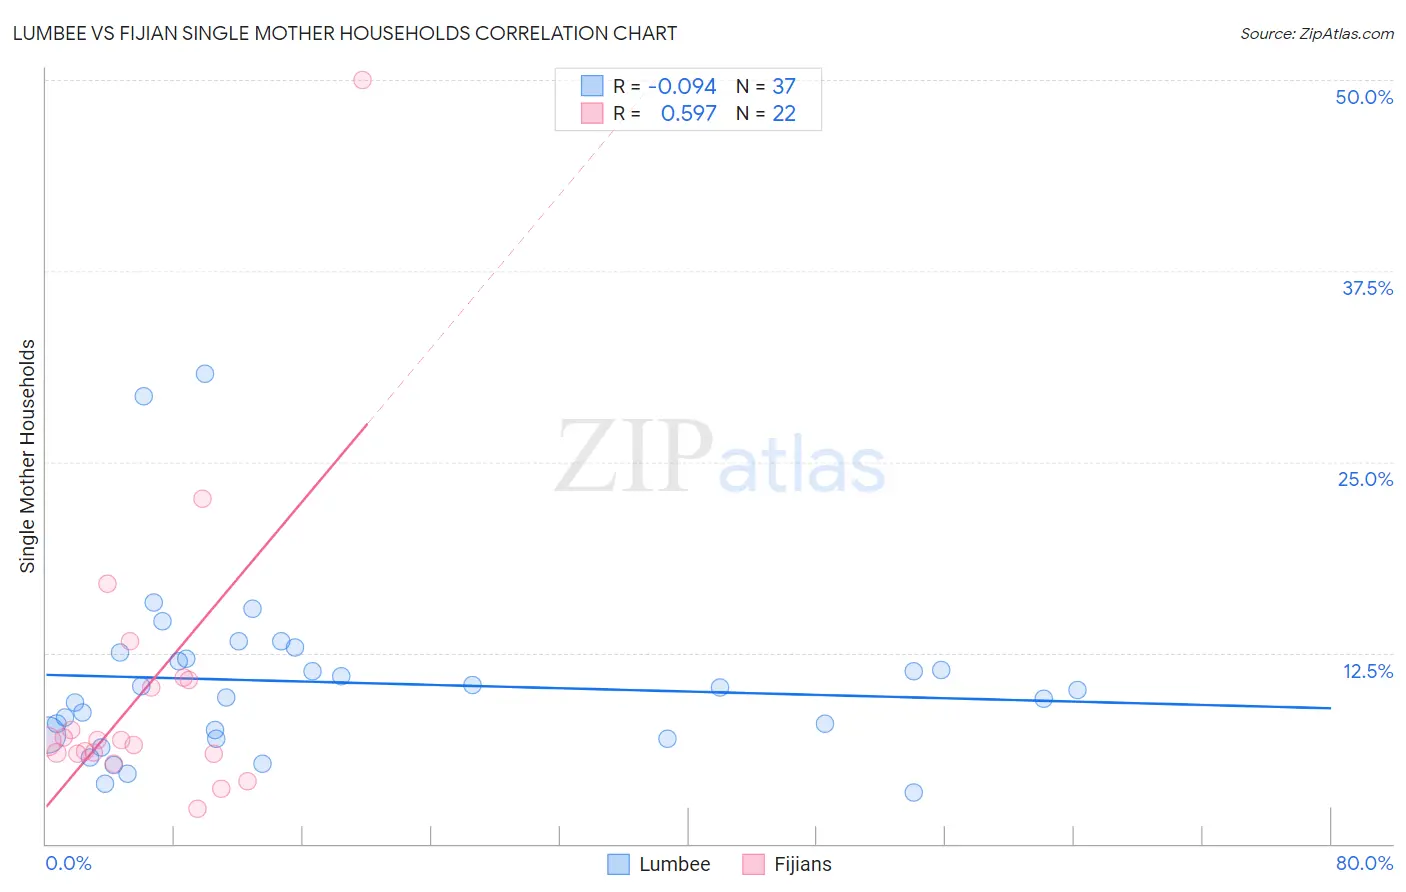
Lumbee vs Fijian Single Mother Households Correlation Chart
The statistical analysis conducted on geographies consisting of 92,236,041 people shows a slight negative correlation between the proportion of Lumbee and percentage of single mother households in the United States with a correlation coefficient (R) of -0.094 and weighted average of 9.1%. Similarly, the statistical analysis conducted on geographies consisting of 55,926,537 people shows a substantial positive correlation between the proportion of Fijians and percentage of single mother households in the United States with a correlation coefficient (R) of 0.597 and weighted average of 7.2%, a difference of 26.5%.
Single Mother Households Correlation Summary
| Measurement | Lumbee | Fijian |
| Minimum | 3.3% | 2.3% |
| Maximum | 30.7% | 50.0% |
| Range | 27.4% | 47.7% |
| Mean | 10.6% | 10.0% |
| Median | 10.0% | 6.7% |
| Interquartile 25% (IQ1) | 7.0% | 5.9% |
| Interquartile 75% (IQ3) | 12.3% | 10.7% |
| Interquartile Range (IQR) | 5.3% | 4.8% |
| Standard Deviation (Sample) | 5.7% | 10.0% |
| Standard Deviation (Population) | 5.6% | 9.8% |
Similar Demographics by Single Mother Households
Demographics Similar to Lumbee by Single Mother Households
In terms of single mother households, the demographic groups most similar to Lumbee are Tohono O'odham (9.1%, a difference of 0.36%), Menominee (9.2%, a difference of 0.68%), Dominican (9.2%, a difference of 0.89%), Black/African American (9.0%, a difference of 1.2%), and Cape Verdean (8.9%, a difference of 2.8%).
| Demographics | Rating | Rank | Single Mother Households |
| Liberians | 0.0 /100 | #333 | Tragic 8.6% |
| Immigrants | Liberia | 0.0 /100 | #334 | Tragic 8.7% |
| Immigrants | Dominica | 0.0 /100 | #335 | Tragic 8.7% |
| Puerto Ricans | 0.0 /100 | #336 | Tragic 8.7% |
| Navajo | 0.0 /100 | #337 | Tragic 8.8% |
| Cape Verdeans | 0.0 /100 | #338 | Tragic 8.9% |
| Blacks/African Americans | 0.0 /100 | #339 | Tragic 9.0% |
| Lumbee | 0.0 /100 | #340 | Tragic 9.1% |
| Tohono O'odham | 0.0 /100 | #341 | Tragic 9.1% |
| Menominee | 0.0 /100 | #342 | Tragic 9.2% |
| Dominicans | 0.0 /100 | #343 | Tragic 9.2% |
| Immigrants | Dominican Republic | 0.0 /100 | #344 | Tragic 9.5% |
| Immigrants | Cabo Verde | 0.0 /100 | #345 | Tragic 9.6% |
| Yuman | 0.0 /100 | #346 | Tragic 9.6% |
| Yup'ik | 0.0 /100 | #347 | Tragic 10.0% |
Demographics Similar to Fijians by Single Mother Households
In terms of single mother households, the demographic groups most similar to Fijians are Ecuadorian (7.2%, a difference of 0.050%), Immigrants from Portugal (7.2%, a difference of 0.080%), Cuban (7.2%, a difference of 0.11%), Immigrants from Panama (7.2%, a difference of 0.43%), and Immigrants from Cambodia (7.2%, a difference of 0.46%).
| Demographics | Rating | Rank | Single Mother Households |
| Immigrants | Burma/Myanmar | 1.4 /100 | #235 | Tragic 7.0% |
| Ute | 1.0 /100 | #236 | Tragic 7.1% |
| Arapaho | 1.0 /100 | #237 | Tragic 7.1% |
| Panamanians | 0.9 /100 | #238 | Tragic 7.1% |
| Kiowa | 0.8 /100 | #239 | Tragic 7.1% |
| Immigrants | Panama | 0.7 /100 | #240 | Tragic 7.2% |
| Immigrants | Portugal | 0.6 /100 | #241 | Tragic 7.2% |
| Fijians | 0.6 /100 | #242 | Tragic 7.2% |
| Ecuadorians | 0.6 /100 | #243 | Tragic 7.2% |
| Cubans | 0.6 /100 | #244 | Tragic 7.2% |
| Immigrants | Cambodia | 0.5 /100 | #245 | Tragic 7.2% |
| Nicaraguans | 0.5 /100 | #246 | Tragic 7.2% |
| Dutch West Indians | 0.4 /100 | #247 | Tragic 7.3% |
| Spanish American Indians | 0.4 /100 | #248 | Tragic 7.3% |
| Bermudans | 0.4 /100 | #249 | Tragic 7.3% |