Yaqui vs Fijian College, 1 year or more
COMPARE
Yaqui
Fijian
College, 1 year or more
College, 1 year or more Comparison
Yaqui
Fijians
53.2%
COLLEGE, 1 YEAR OR MORE
0.0/ 100
METRIC RATING
295th/ 347
METRIC RANK
51.3%
COLLEGE, 1 YEAR OR MORE
0.0/ 100
METRIC RATING
314th/ 347
METRIC RANK
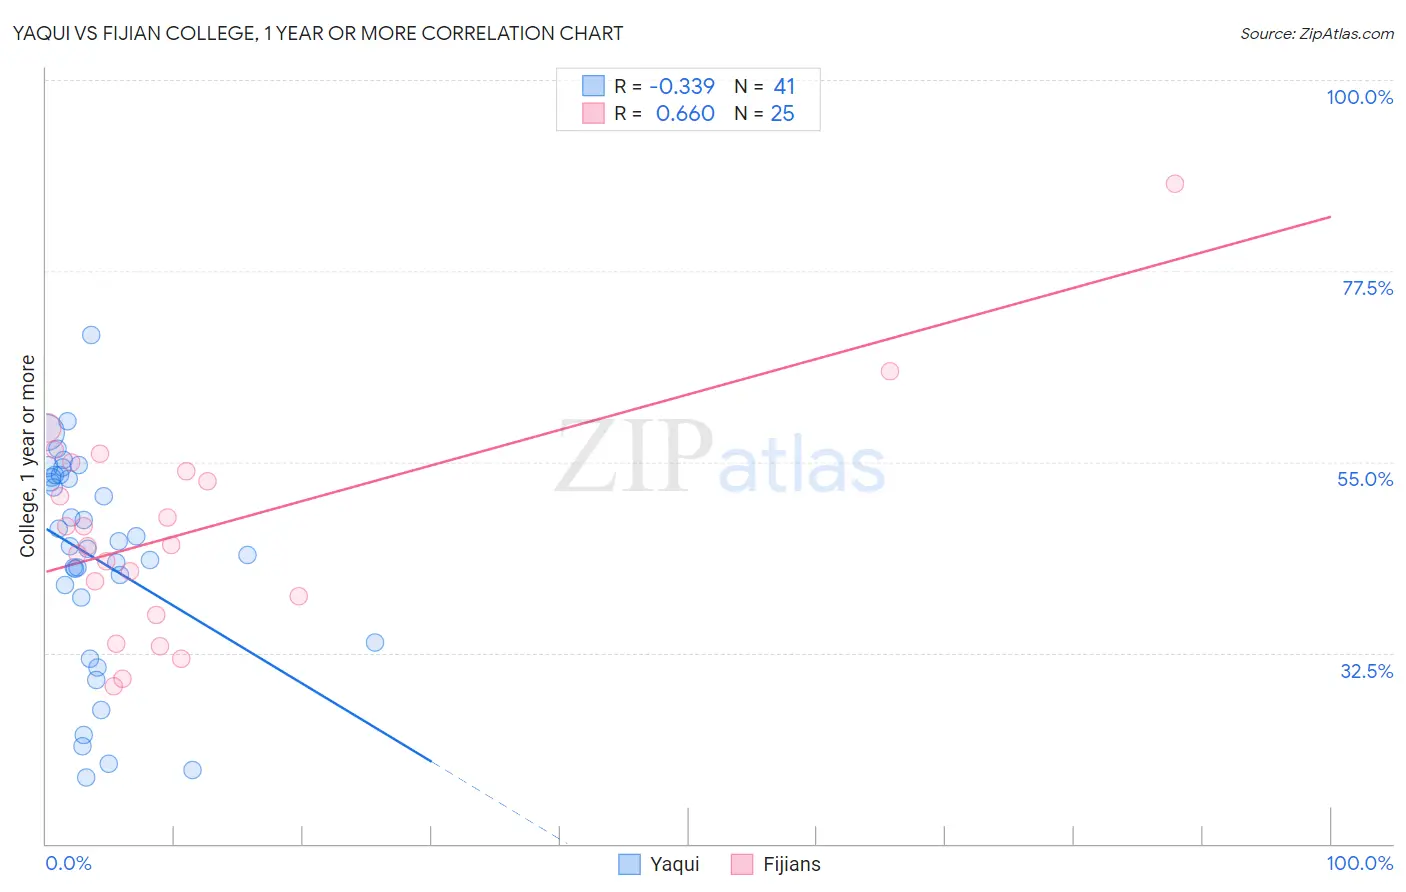
Yaqui vs Fijian College, 1 year or more Correlation Chart
The statistical analysis conducted on geographies consisting of 107,738,640 people shows a mild negative correlation between the proportion of Yaqui and percentage of population with at least college, 1 year or more education in the United States with a correlation coefficient (R) of -0.339 and weighted average of 53.2%. Similarly, the statistical analysis conducted on geographies consisting of 55,948,842 people shows a significant positive correlation between the proportion of Fijians and percentage of population with at least college, 1 year or more education in the United States with a correlation coefficient (R) of 0.660 and weighted average of 51.3%, a difference of 3.6%.
College, 1 year or more Correlation Summary
| Measurement | Yaqui | Fijian |
| Minimum | 17.9% | 28.6% |
| Maximum | 69.9% | 87.8% |
| Range | 52.0% | 59.3% |
| Mean | 43.6% | 47.0% |
| Median | 45.0% | 45.2% |
| Interquartile 25% (IQ1) | 36.3% | 38.0% |
| Interquartile 75% (IQ3) | 53.3% | 54.4% |
| Interquartile Range (IQR) | 17.0% | 16.4% |
| Standard Deviation (Sample) | 12.5% | 12.9% |
| Standard Deviation (Population) | 12.3% | 12.6% |
Demographics Similar to Yaqui and Fijians by College, 1 year or more
In terms of college, 1 year or more, the demographic groups most similar to Yaqui are Cherokee (53.2%, a difference of 0.010%), Sioux (53.0%, a difference of 0.34%), Paiute (52.9%, a difference of 0.62%), Immigrants from Dominica (52.5%, a difference of 1.2%), and Immigrants from Nicaragua (52.4%, a difference of 1.6%). Similarly, the demographic groups most similar to Fijians are Immigrants from Caribbean (51.4%, a difference of 0.22%), Pueblo (51.5%, a difference of 0.35%), Immigrants from Haiti (51.5%, a difference of 0.39%), Honduran (51.6%, a difference of 0.55%), and Apache (51.8%, a difference of 0.94%).
| Demographics | Rating | Rank | College, 1 year or more |
| Cherokee | 0.0 /100 | #294 | Tragic 53.2% |
| Yaqui | 0.0 /100 | #295 | Tragic 53.2% |
| Sioux | 0.0 /100 | #296 | Tragic 53.0% |
| Paiute | 0.0 /100 | #297 | Tragic 52.9% |
| Immigrants | Dominica | 0.0 /100 | #298 | Tragic 52.5% |
| Immigrants | Nicaragua | 0.0 /100 | #299 | Tragic 52.4% |
| Choctaw | 0.0 /100 | #300 | Tragic 52.3% |
| Haitians | 0.0 /100 | #301 | Tragic 52.3% |
| Puerto Ricans | 0.0 /100 | #302 | Tragic 52.2% |
| Creek | 0.0 /100 | #303 | Tragic 52.2% |
| Central Americans | 0.0 /100 | #304 | Tragic 52.1% |
| Seminole | 0.0 /100 | #305 | Tragic 52.1% |
| Mexican American Indians | 0.0 /100 | #306 | Tragic 51.9% |
| Immigrants | Portugal | 0.0 /100 | #307 | Tragic 51.9% |
| Salvadorans | 0.0 /100 | #308 | Tragic 51.8% |
| Apache | 0.0 /100 | #309 | Tragic 51.8% |
| Hondurans | 0.0 /100 | #310 | Tragic 51.6% |
| Immigrants | Haiti | 0.0 /100 | #311 | Tragic 51.5% |
| Pueblo | 0.0 /100 | #312 | Tragic 51.5% |
| Immigrants | Caribbean | 0.0 /100 | #313 | Tragic 51.4% |
| Fijians | 0.0 /100 | #314 | Tragic 51.3% |