Inupiat vs Immigrants from Romania Doctorate Degree
COMPARE
Inupiat
Immigrants from Romania
Doctorate Degree
Doctorate Degree Comparison
Inupiat
Immigrants from Romania
1.3%
DOCTORATE DEGREE
0.0/ 100
METRIC RATING
328th/ 347
METRIC RANK
2.1%
DOCTORATE DEGREE
98.7/ 100
METRIC RATING
95th/ 347
METRIC RANK
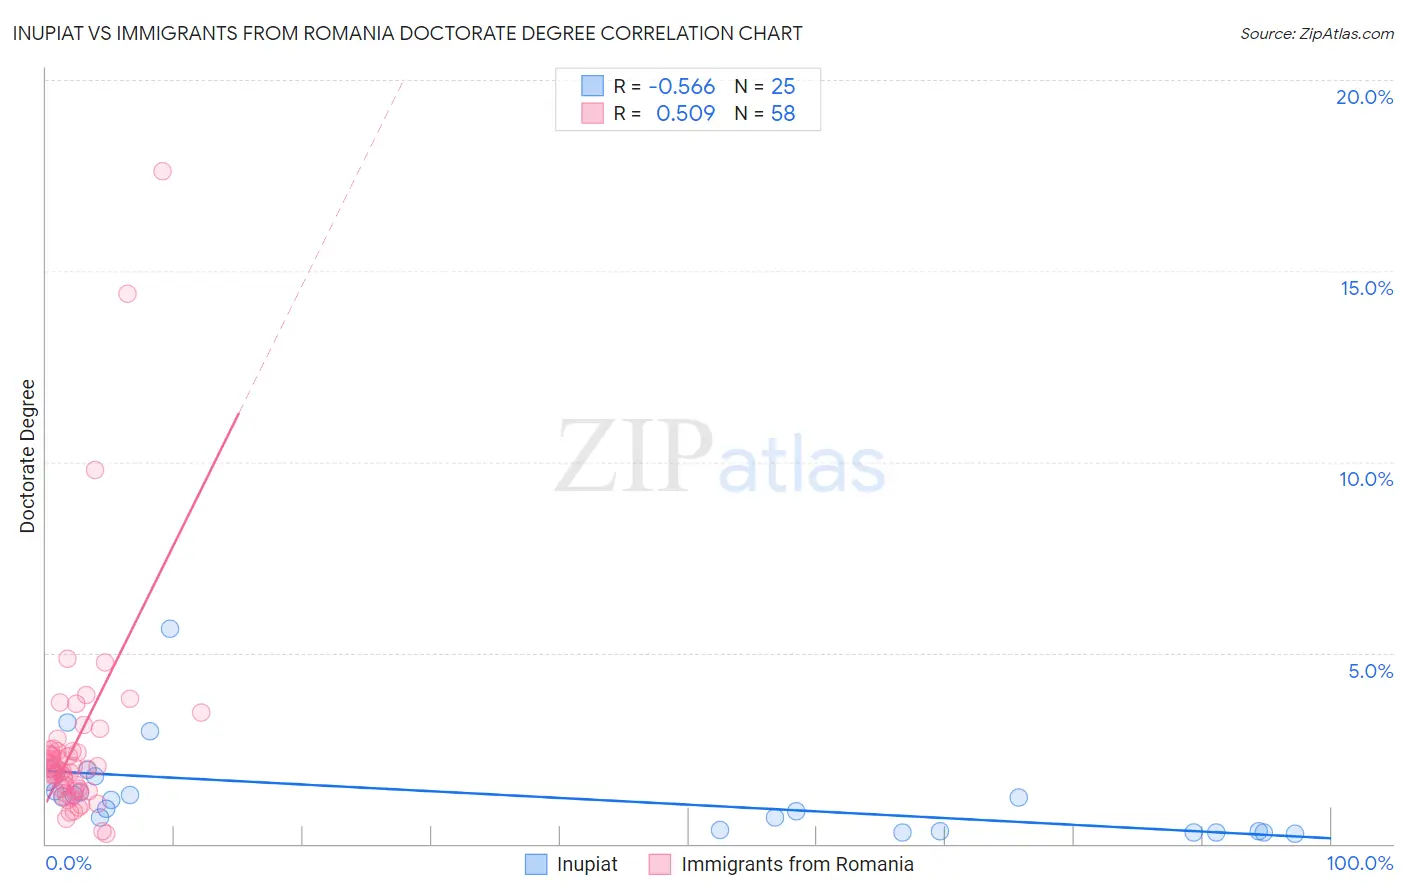
Inupiat vs Immigrants from Romania Doctorate Degree Correlation Chart
The statistical analysis conducted on geographies consisting of 95,805,354 people shows a substantial negative correlation between the proportion of Inupiat and percentage of population with at least doctorate degree education in the United States with a correlation coefficient (R) of -0.566 and weighted average of 1.3%. Similarly, the statistical analysis conducted on geographies consisting of 256,246,165 people shows a substantial positive correlation between the proportion of Immigrants from Romania and percentage of population with at least doctorate degree education in the United States with a correlation coefficient (R) of 0.509 and weighted average of 2.1%, a difference of 63.0%.
Doctorate Degree Correlation Summary
| Measurement | Inupiat | Immigrants from Romania |
| Minimum | 0.27% | 0.25% |
| Maximum | 5.6% | 17.6% |
| Range | 5.4% | 17.4% |
| Mean | 1.3% | 2.7% |
| Median | 1.1% | 2.0% |
| Interquartile 25% (IQ1) | 0.33% | 1.4% |
| Interquartile 75% (IQ3) | 1.6% | 2.4% |
| Interquartile Range (IQR) | 1.2% | 1.1% |
| Standard Deviation (Sample) | 1.2% | 2.9% |
| Standard Deviation (Population) | 1.2% | 2.9% |
Similar Demographics by Doctorate Degree
Demographics Similar to Inupiat by Doctorate Degree
In terms of doctorate degree, the demographic groups most similar to Inupiat are Haitian (1.3%, a difference of 0.050%), Yup'ik (1.3%, a difference of 0.27%), Immigrants from Latin America (1.3%, a difference of 0.28%), Hispanic or Latino (1.3%, a difference of 0.58%), and Immigrants from Cabo Verde (1.3%, a difference of 0.87%).
| Demographics | Rating | Rank | Doctorate Degree |
| Dutch West Indians | 0.1 /100 | #321 | Tragic 1.3% |
| Seminole | 0.1 /100 | #322 | Tragic 1.3% |
| Immigrants | Belize | 0.1 /100 | #323 | Tragic 1.3% |
| Natives/Alaskans | 0.0 /100 | #324 | Tragic 1.3% |
| Pima | 0.0 /100 | #325 | Tragic 1.3% |
| Immigrants | Cabo Verde | 0.0 /100 | #326 | Tragic 1.3% |
| Hispanics or Latinos | 0.0 /100 | #327 | Tragic 1.3% |
| Inupiat | 0.0 /100 | #328 | Tragic 1.3% |
| Haitians | 0.0 /100 | #329 | Tragic 1.3% |
| Yup'ik | 0.0 /100 | #330 | Tragic 1.3% |
| Immigrants | Latin America | 0.0 /100 | #331 | Tragic 1.3% |
| Yakama | 0.0 /100 | #332 | Tragic 1.3% |
| Immigrants | Caribbean | 0.0 /100 | #333 | Tragic 1.3% |
| Immigrants | Dominican Republic | 0.0 /100 | #334 | Tragic 1.3% |
| Immigrants | Haiti | 0.0 /100 | #335 | Tragic 1.3% |
Demographics Similar to Immigrants from Romania by Doctorate Degree
In terms of doctorate degree, the demographic groups most similar to Immigrants from Romania are Greek (2.1%, a difference of 0.15%), Immigrants from Northern Africa (2.1%, a difference of 0.59%), Immigrants from Eritrea (2.1%, a difference of 0.72%), Alsatian (2.1%, a difference of 0.78%), and Armenian (2.1%, a difference of 0.80%).
| Demographics | Rating | Rank | Doctorate Degree |
| Immigrants | Nepal | 99.3 /100 | #88 | Exceptional 2.2% |
| British | 99.3 /100 | #89 | Exceptional 2.2% |
| Immigrants | Scotland | 99.2 /100 | #90 | Exceptional 2.2% |
| Immigrants | Sudan | 99.1 /100 | #91 | Exceptional 2.2% |
| Chileans | 99.1 /100 | #92 | Exceptional 2.2% |
| Alsatians | 99.0 /100 | #93 | Exceptional 2.1% |
| Greeks | 98.8 /100 | #94 | Exceptional 2.1% |
| Immigrants | Romania | 98.7 /100 | #95 | Exceptional 2.1% |
| Immigrants | Northern Africa | 98.4 /100 | #96 | Exceptional 2.1% |
| Immigrants | Eritrea | 98.4 /100 | #97 | Exceptional 2.1% |
| Armenians | 98.3 /100 | #98 | Exceptional 2.1% |
| Immigrants | Egypt | 98.2 /100 | #99 | Exceptional 2.1% |
| Immigrants | Eastern Europe | 98.2 /100 | #100 | Exceptional 2.1% |
| Immigrants | Eastern Africa | 98.2 /100 | #101 | Exceptional 2.1% |
| Immigrants | Chile | 98.1 /100 | #102 | Exceptional 2.1% |