Maltese vs Immigrants from Romania Doctorate Degree
COMPARE
Maltese
Immigrants from Romania
Doctorate Degree
Doctorate Degree Comparison
Maltese
Immigrants from Romania
2.1%
DOCTORATE DEGREE
96.2/ 100
METRIC RATING
116th/ 347
METRIC RANK
2.1%
DOCTORATE DEGREE
98.7/ 100
METRIC RATING
95th/ 347
METRIC RANK
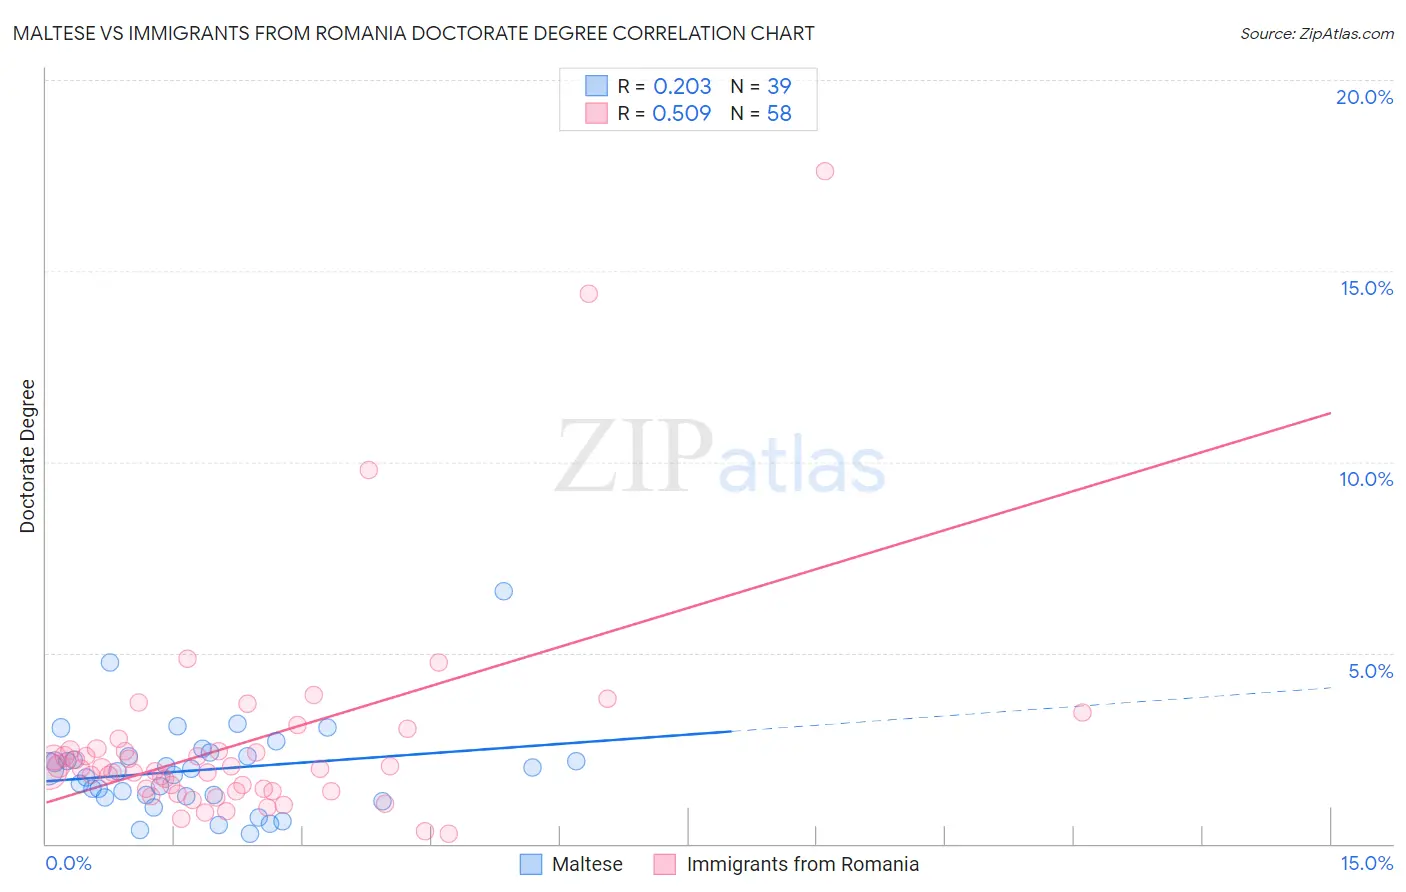
Maltese vs Immigrants from Romania Doctorate Degree Correlation Chart
The statistical analysis conducted on geographies consisting of 126,152,817 people shows a weak positive correlation between the proportion of Maltese and percentage of population with at least doctorate degree education in the United States with a correlation coefficient (R) of 0.203 and weighted average of 2.1%. Similarly, the statistical analysis conducted on geographies consisting of 256,246,165 people shows a substantial positive correlation between the proportion of Immigrants from Romania and percentage of population with at least doctorate degree education in the United States with a correlation coefficient (R) of 0.509 and weighted average of 2.1%, a difference of 3.6%.
Doctorate Degree Correlation Summary
| Measurement | Maltese | Immigrants from Romania |
| Minimum | 0.25% | 0.25% |
| Maximum | 6.6% | 17.6% |
| Range | 6.4% | 17.4% |
| Mean | 1.9% | 2.7% |
| Median | 1.9% | 2.0% |
| Interquartile 25% (IQ1) | 1.2% | 1.4% |
| Interquartile 75% (IQ3) | 2.3% | 2.4% |
| Interquartile Range (IQR) | 1.1% | 1.1% |
| Standard Deviation (Sample) | 1.2% | 2.9% |
| Standard Deviation (Population) | 1.2% | 2.9% |
Similar Demographics by Doctorate Degree
Demographics Similar to Maltese by Doctorate Degree
In terms of doctorate degree, the demographic groups most similar to Maltese are Lebanese (2.1%, a difference of 0.17%), Icelander (2.1%, a difference of 0.21%), Pakistani (2.0%, a difference of 0.34%), Taiwanese (2.1%, a difference of 0.46%), and Immigrants from Croatia (2.1%, a difference of 0.54%).
| Demographics | Rating | Rank | Doctorate Degree |
| Ukrainians | 97.2 /100 | #109 | Exceptional 2.1% |
| Brazilians | 97.2 /100 | #110 | Exceptional 2.1% |
| Immigrants | Pakistan | 97.1 /100 | #111 | Exceptional 2.1% |
| Syrians | 97.1 /100 | #112 | Exceptional 2.1% |
| Immigrants | Italy | 96.9 /100 | #113 | Exceptional 2.1% |
| Immigrants | Croatia | 96.8 /100 | #114 | Exceptional 2.1% |
| Taiwanese | 96.7 /100 | #115 | Exceptional 2.1% |
| Maltese | 96.2 /100 | #116 | Exceptional 2.1% |
| Lebanese | 96.0 /100 | #117 | Exceptional 2.1% |
| Icelanders | 96.0 /100 | #118 | Exceptional 2.1% |
| Pakistanis | 95.8 /100 | #119 | Exceptional 2.0% |
| Immigrants | Morocco | 95.5 /100 | #120 | Exceptional 2.0% |
| Immigrants | Jordan | 94.8 /100 | #121 | Exceptional 2.0% |
| Immigrants | Southern Europe | 94.7 /100 | #122 | Exceptional 2.0% |
| Croatians | 94.0 /100 | #123 | Exceptional 2.0% |
Demographics Similar to Immigrants from Romania by Doctorate Degree
In terms of doctorate degree, the demographic groups most similar to Immigrants from Romania are Greek (2.1%, a difference of 0.15%), Immigrants from Northern Africa (2.1%, a difference of 0.59%), Immigrants from Eritrea (2.1%, a difference of 0.72%), Alsatian (2.1%, a difference of 0.78%), and Armenian (2.1%, a difference of 0.80%).
| Demographics | Rating | Rank | Doctorate Degree |
| Immigrants | Nepal | 99.3 /100 | #88 | Exceptional 2.2% |
| British | 99.3 /100 | #89 | Exceptional 2.2% |
| Immigrants | Scotland | 99.2 /100 | #90 | Exceptional 2.2% |
| Immigrants | Sudan | 99.1 /100 | #91 | Exceptional 2.2% |
| Chileans | 99.1 /100 | #92 | Exceptional 2.2% |
| Alsatians | 99.0 /100 | #93 | Exceptional 2.1% |
| Greeks | 98.8 /100 | #94 | Exceptional 2.1% |
| Immigrants | Romania | 98.7 /100 | #95 | Exceptional 2.1% |
| Immigrants | Northern Africa | 98.4 /100 | #96 | Exceptional 2.1% |
| Immigrants | Eritrea | 98.4 /100 | #97 | Exceptional 2.1% |
| Armenians | 98.3 /100 | #98 | Exceptional 2.1% |
| Immigrants | Egypt | 98.2 /100 | #99 | Exceptional 2.1% |
| Immigrants | Eastern Europe | 98.2 /100 | #100 | Exceptional 2.1% |
| Immigrants | Eastern Africa | 98.2 /100 | #101 | Exceptional 2.1% |
| Immigrants | Chile | 98.1 /100 | #102 | Exceptional 2.1% |