Comanche vs Immigrants from Romania Doctorate Degree
COMPARE
Comanche
Immigrants from Romania
Doctorate Degree
Doctorate Degree Comparison
Comanche
Immigrants from Romania
1.6%
DOCTORATE DEGREE
1.8/ 100
METRIC RATING
247th/ 347
METRIC RANK
2.1%
DOCTORATE DEGREE
98.7/ 100
METRIC RATING
95th/ 347
METRIC RANK
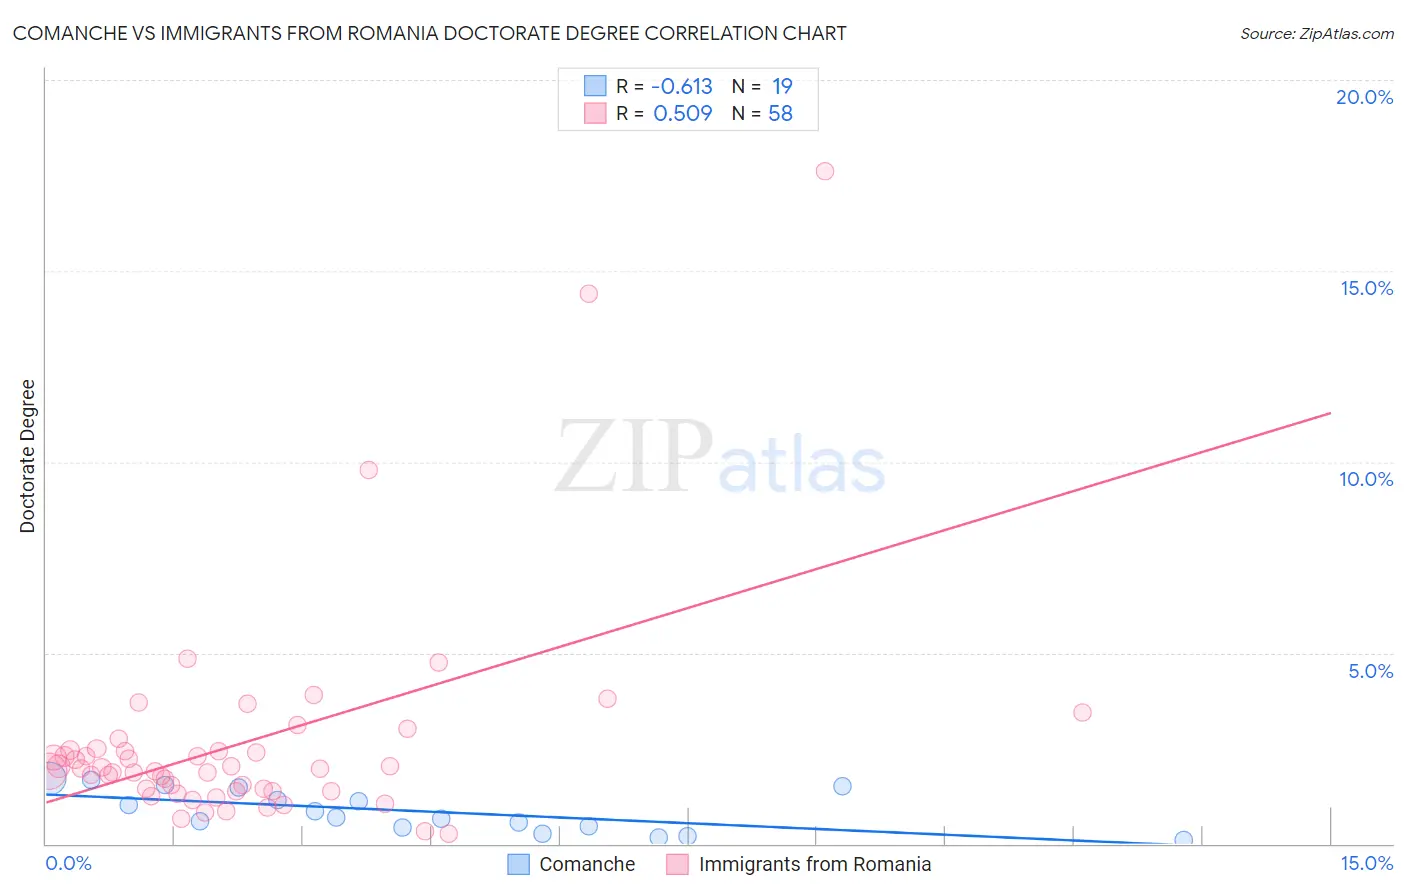
Comanche vs Immigrants from Romania Doctorate Degree Correlation Chart
The statistical analysis conducted on geographies consisting of 108,720,636 people shows a significant negative correlation between the proportion of Comanche and percentage of population with at least doctorate degree education in the United States with a correlation coefficient (R) of -0.613 and weighted average of 1.6%. Similarly, the statistical analysis conducted on geographies consisting of 256,246,165 people shows a substantial positive correlation between the proportion of Immigrants from Romania and percentage of population with at least doctorate degree education in the United States with a correlation coefficient (R) of 0.509 and weighted average of 2.1%, a difference of 35.7%.
Doctorate Degree Correlation Summary
| Measurement | Comanche | Immigrants from Romania |
| Minimum | 0.10% | 0.25% |
| Maximum | 1.7% | 17.6% |
| Range | 1.6% | 17.4% |
| Mean | 0.85% | 2.7% |
| Median | 0.67% | 2.0% |
| Interquartile 25% (IQ1) | 0.43% | 1.4% |
| Interquartile 75% (IQ3) | 1.5% | 2.4% |
| Interquartile Range (IQR) | 1.0% | 1.1% |
| Standard Deviation (Sample) | 0.54% | 2.9% |
| Standard Deviation (Population) | 0.53% | 2.9% |
Similar Demographics by Doctorate Degree
Demographics Similar to Comanche by Doctorate Degree
In terms of doctorate degree, the demographic groups most similar to Comanche are Hmong (1.6%, a difference of 0.020%), Delaware (1.6%, a difference of 0.12%), African (1.6%, a difference of 0.12%), French American Indian (1.6%, a difference of 0.49%), and Potawatomi (1.6%, a difference of 0.59%).
| Demographics | Rating | Rank | Doctorate Degree |
| Immigrants | Panama | 2.4 /100 | #240 | Tragic 1.6% |
| Cheyenne | 2.3 /100 | #241 | Tragic 1.6% |
| Ottawa | 2.2 /100 | #242 | Tragic 1.6% |
| Native Hawaiians | 2.1 /100 | #243 | Tragic 1.6% |
| French American Indians | 2.0 /100 | #244 | Tragic 1.6% |
| Delaware | 1.9 /100 | #245 | Tragic 1.6% |
| Hmong | 1.8 /100 | #246 | Tragic 1.6% |
| Comanche | 1.8 /100 | #247 | Tragic 1.6% |
| Africans | 1.8 /100 | #248 | Tragic 1.6% |
| Potawatomi | 1.6 /100 | #249 | Tragic 1.6% |
| Immigrants | Fiji | 1.6 /100 | #250 | Tragic 1.6% |
| Apache | 1.3 /100 | #251 | Tragic 1.5% |
| Yuman | 1.1 /100 | #252 | Tragic 1.5% |
| Americans | 1.0 /100 | #253 | Tragic 1.5% |
| Immigrants | Cambodia | 1.0 /100 | #254 | Tragic 1.5% |
Demographics Similar to Immigrants from Romania by Doctorate Degree
In terms of doctorate degree, the demographic groups most similar to Immigrants from Romania are Greek (2.1%, a difference of 0.15%), Immigrants from Northern Africa (2.1%, a difference of 0.59%), Immigrants from Eritrea (2.1%, a difference of 0.72%), Alsatian (2.1%, a difference of 0.78%), and Armenian (2.1%, a difference of 0.80%).
| Demographics | Rating | Rank | Doctorate Degree |
| Immigrants | Nepal | 99.3 /100 | #88 | Exceptional 2.2% |
| British | 99.3 /100 | #89 | Exceptional 2.2% |
| Immigrants | Scotland | 99.2 /100 | #90 | Exceptional 2.2% |
| Immigrants | Sudan | 99.1 /100 | #91 | Exceptional 2.2% |
| Chileans | 99.1 /100 | #92 | Exceptional 2.2% |
| Alsatians | 99.0 /100 | #93 | Exceptional 2.1% |
| Greeks | 98.8 /100 | #94 | Exceptional 2.1% |
| Immigrants | Romania | 98.7 /100 | #95 | Exceptional 2.1% |
| Immigrants | Northern Africa | 98.4 /100 | #96 | Exceptional 2.1% |
| Immigrants | Eritrea | 98.4 /100 | #97 | Exceptional 2.1% |
| Armenians | 98.3 /100 | #98 | Exceptional 2.1% |
| Immigrants | Egypt | 98.2 /100 | #99 | Exceptional 2.1% |
| Immigrants | Eastern Europe | 98.2 /100 | #100 | Exceptional 2.1% |
| Immigrants | Eastern Africa | 98.2 /100 | #101 | Exceptional 2.1% |
| Immigrants | Chile | 98.1 /100 | #102 | Exceptional 2.1% |