Immigrants from Western Europe vs Slavic Doctorate Degree
COMPARE
Immigrants from Western Europe
Slavic
Doctorate Degree
Doctorate Degree Comparison
Immigrants from Western Europe
Slavs
2.4%
DOCTORATE DEGREE
100.0/ 100
METRIC RATING
47th/ 347
METRIC RANK
1.9%
DOCTORATE DEGREE
72.4/ 100
METRIC RATING
156th/ 347
METRIC RANK
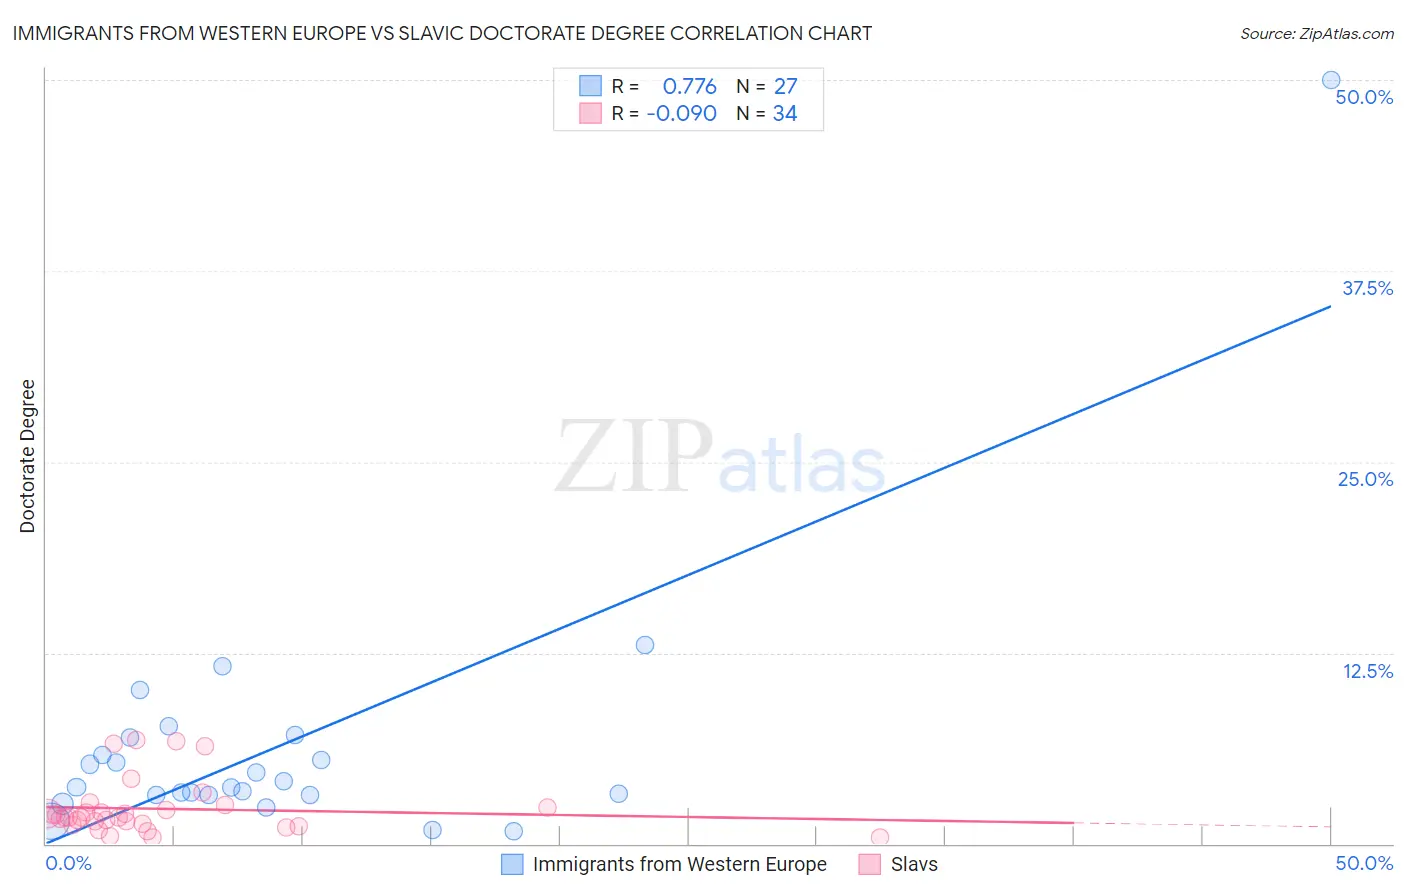
Immigrants from Western Europe vs Slavic Doctorate Degree Correlation Chart
The statistical analysis conducted on geographies consisting of 485,772,284 people shows a strong positive correlation between the proportion of Immigrants from Western Europe and percentage of population with at least doctorate degree education in the United States with a correlation coefficient (R) of 0.776 and weighted average of 2.4%. Similarly, the statistical analysis conducted on geographies consisting of 269,161,958 people shows a slight negative correlation between the proportion of Slavs and percentage of population with at least doctorate degree education in the United States with a correlation coefficient (R) of -0.090 and weighted average of 1.9%, a difference of 27.9%.
Doctorate Degree Correlation Summary
| Measurement | Immigrants from Western Europe | Slavic |
| Minimum | 0.81% | 0.39% |
| Maximum | 50.0% | 6.8% |
| Range | 49.2% | 6.4% |
| Mean | 6.5% | 2.3% |
| Median | 3.7% | 1.7% |
| Interquartile 25% (IQ1) | 3.2% | 1.3% |
| Interquartile 75% (IQ3) | 7.0% | 2.3% |
| Interquartile Range (IQR) | 3.8% | 1.0% |
| Standard Deviation (Sample) | 9.2% | 1.8% |
| Standard Deviation (Population) | 9.0% | 1.8% |
Similar Demographics by Doctorate Degree
Demographics Similar to Immigrants from Western Europe by Doctorate Degree
In terms of doctorate degree, the demographic groups most similar to Immigrants from Western Europe are Asian (2.4%, a difference of 0.21%), Immigrants from Austria (2.4%, a difference of 0.22%), Immigrants from Asia (2.4%, a difference of 0.34%), Immigrants from South Africa (2.4%, a difference of 0.36%), and Immigrants from Norway (2.4%, a difference of 1.5%).
| Demographics | Rating | Rank | Doctorate Degree |
| Estonians | 100.0 /100 | #40 | Exceptional 2.5% |
| Immigrants | Russia | 100.0 /100 | #41 | Exceptional 2.5% |
| New Zealanders | 100.0 /100 | #42 | Exceptional 2.5% |
| Soviet Union | 100.0 /100 | #43 | Exceptional 2.5% |
| Immigrants | Netherlands | 100.0 /100 | #44 | Exceptional 2.5% |
| Immigrants | South Africa | 100.0 /100 | #45 | Exceptional 2.4% |
| Immigrants | Austria | 100.0 /100 | #46 | Exceptional 2.4% |
| Immigrants | Western Europe | 100.0 /100 | #47 | Exceptional 2.4% |
| Asians | 100.0 /100 | #48 | Exceptional 2.4% |
| Immigrants | Asia | 100.0 /100 | #49 | Exceptional 2.4% |
| Immigrants | Norway | 100.0 /100 | #50 | Exceptional 2.4% |
| Australians | 100.0 /100 | #51 | Exceptional 2.4% |
| Bulgarians | 100.0 /100 | #52 | Exceptional 2.4% |
| Immigrants | Latvia | 100.0 /100 | #53 | Exceptional 2.4% |
| Immigrants | Indonesia | 100.0 /100 | #54 | Exceptional 2.4% |
Demographics Similar to Slavs by Doctorate Degree
In terms of doctorate degree, the demographic groups most similar to Slavs are Polish (1.9%, a difference of 0.060%), Immigrants from Albania (1.9%, a difference of 0.080%), Danish (1.9%, a difference of 0.090%), Hungarian (1.9%, a difference of 0.11%), and Immigrants from Oceania (1.9%, a difference of 0.30%).
| Demographics | Rating | Rank | Doctorate Degree |
| Basques | 76.9 /100 | #149 | Good 1.9% |
| English | 75.9 /100 | #150 | Good 1.9% |
| Albanians | 74.8 /100 | #151 | Good 1.9% |
| Immigrants | Kenya | 74.3 /100 | #152 | Good 1.9% |
| Immigrants | Oceania | 74.0 /100 | #153 | Good 1.9% |
| Immigrants | Albania | 72.8 /100 | #154 | Good 1.9% |
| Poles | 72.7 /100 | #155 | Good 1.9% |
| Slavs | 72.4 /100 | #156 | Good 1.9% |
| Danes | 71.9 /100 | #157 | Good 1.9% |
| Hungarians | 71.7 /100 | #158 | Good 1.9% |
| Slovenes | 70.2 /100 | #159 | Good 1.9% |
| Welsh | 69.7 /100 | #160 | Good 1.9% |
| Immigrants | Middle Africa | 68.8 /100 | #161 | Good 1.9% |
| Irish | 67.5 /100 | #162 | Good 1.9% |
| Czechs | 67.3 /100 | #163 | Good 1.9% |