Immigrants from Saudi Arabia vs Slavic Doctorate Degree
COMPARE
Immigrants from Saudi Arabia
Slavic
Doctorate Degree
Doctorate Degree Comparison
Immigrants from Saudi Arabia
Slavs
2.7%
DOCTORATE DEGREE
100.0/ 100
METRIC RATING
25th/ 347
METRIC RANK
1.9%
DOCTORATE DEGREE
72.4/ 100
METRIC RATING
156th/ 347
METRIC RANK
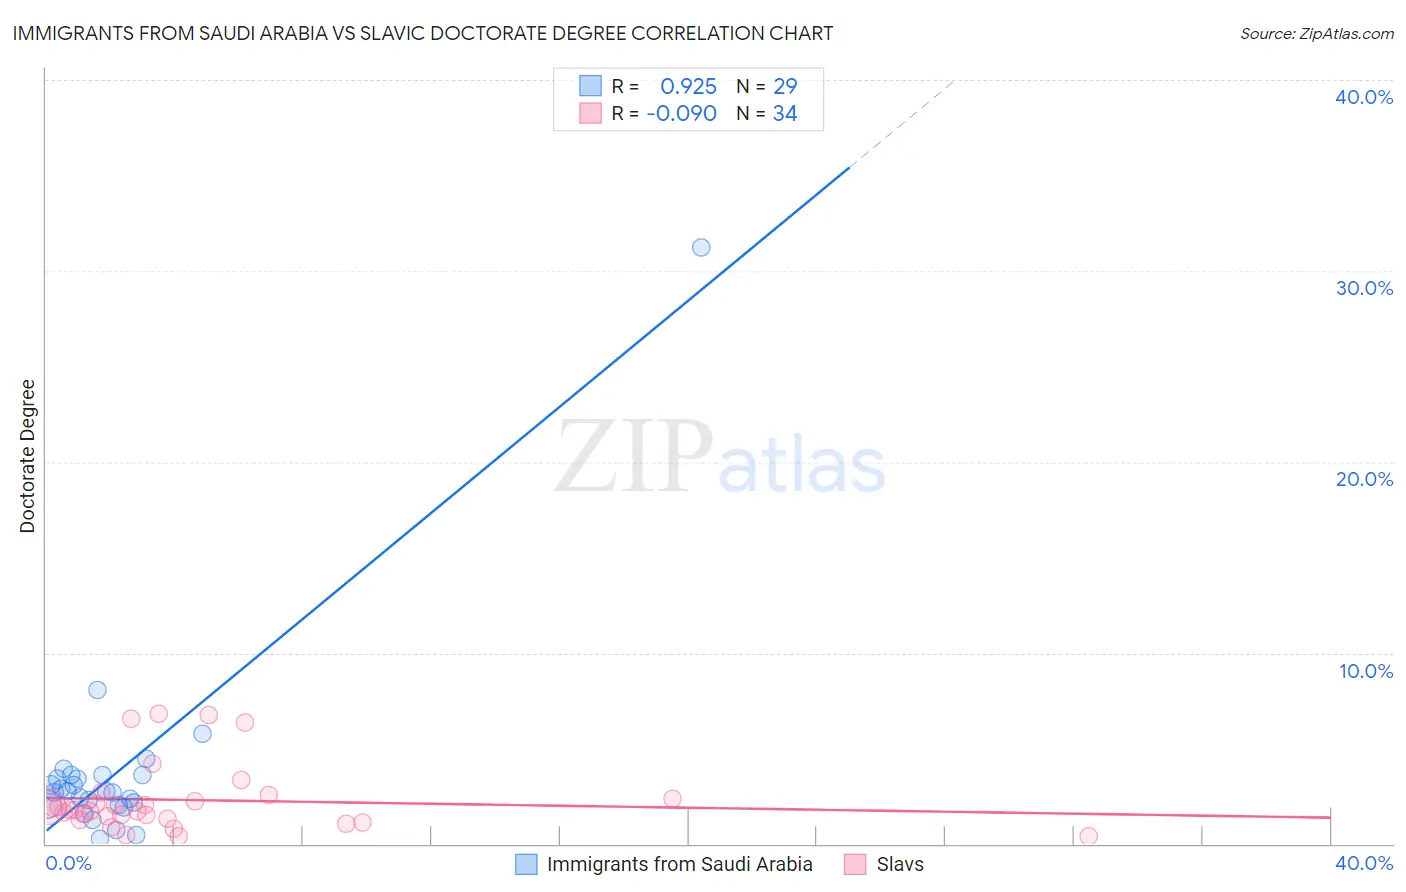
Immigrants from Saudi Arabia vs Slavic Doctorate Degree Correlation Chart
The statistical analysis conducted on geographies consisting of 164,069,044 people shows a near-perfect positive correlation between the proportion of Immigrants from Saudi Arabia and percentage of population with at least doctorate degree education in the United States with a correlation coefficient (R) of 0.925 and weighted average of 2.7%. Similarly, the statistical analysis conducted on geographies consisting of 269,161,958 people shows a slight negative correlation between the proportion of Slavs and percentage of population with at least doctorate degree education in the United States with a correlation coefficient (R) of -0.090 and weighted average of 1.9%, a difference of 40.8%.
Doctorate Degree Correlation Summary
| Measurement | Immigrants from Saudi Arabia | Slavic |
| Minimum | 0.29% | 0.39% |
| Maximum | 31.2% | 6.8% |
| Range | 31.0% | 6.4% |
| Mean | 3.8% | 2.3% |
| Median | 2.7% | 1.7% |
| Interquartile 25% (IQ1) | 2.1% | 1.3% |
| Interquartile 75% (IQ3) | 3.6% | 2.3% |
| Interquartile Range (IQR) | 1.5% | 1.0% |
| Standard Deviation (Sample) | 5.5% | 1.8% |
| Standard Deviation (Population) | 5.4% | 1.8% |
Similar Demographics by Doctorate Degree
Demographics Similar to Immigrants from Saudi Arabia by Doctorate Degree
In terms of doctorate degree, the demographic groups most similar to Immigrants from Saudi Arabia are Turkish (2.7%, a difference of 0.52%), Immigrants from Turkey (2.6%, a difference of 1.4%), Israeli (2.7%, a difference of 1.5%), Burmese (2.6%, a difference of 1.7%), and Immigrants from South Central Asia (2.6%, a difference of 2.0%).
| Demographics | Rating | Rank | Doctorate Degree |
| Immigrants | Sri Lanka | 100.0 /100 | #18 | Exceptional 2.8% |
| Immigrants | Japan | 100.0 /100 | #19 | Exceptional 2.8% |
| Immigrants | Hong Kong | 100.0 /100 | #20 | Exceptional 2.8% |
| Thais | 100.0 /100 | #21 | Exceptional 2.8% |
| Mongolians | 100.0 /100 | #22 | Exceptional 2.8% |
| Immigrants | Denmark | 100.0 /100 | #23 | Exceptional 2.8% |
| Israelis | 100.0 /100 | #24 | Exceptional 2.7% |
| Immigrants | Saudi Arabia | 100.0 /100 | #25 | Exceptional 2.7% |
| Turks | 100.0 /100 | #26 | Exceptional 2.7% |
| Immigrants | Turkey | 100.0 /100 | #27 | Exceptional 2.6% |
| Burmese | 100.0 /100 | #28 | Exceptional 2.6% |
| Immigrants | South Central Asia | 100.0 /100 | #29 | Exceptional 2.6% |
| Immigrants | Korea | 100.0 /100 | #30 | Exceptional 2.6% |
| Latvians | 100.0 /100 | #31 | Exceptional 2.6% |
| Immigrants | Northern Europe | 100.0 /100 | #32 | Exceptional 2.6% |
Demographics Similar to Slavs by Doctorate Degree
In terms of doctorate degree, the demographic groups most similar to Slavs are Polish (1.9%, a difference of 0.060%), Immigrants from Albania (1.9%, a difference of 0.080%), Danish (1.9%, a difference of 0.090%), Hungarian (1.9%, a difference of 0.11%), and Immigrants from Oceania (1.9%, a difference of 0.30%).
| Demographics | Rating | Rank | Doctorate Degree |
| Basques | 76.9 /100 | #149 | Good 1.9% |
| English | 75.9 /100 | #150 | Good 1.9% |
| Albanians | 74.8 /100 | #151 | Good 1.9% |
| Immigrants | Kenya | 74.3 /100 | #152 | Good 1.9% |
| Immigrants | Oceania | 74.0 /100 | #153 | Good 1.9% |
| Immigrants | Albania | 72.8 /100 | #154 | Good 1.9% |
| Poles | 72.7 /100 | #155 | Good 1.9% |
| Slavs | 72.4 /100 | #156 | Good 1.9% |
| Danes | 71.9 /100 | #157 | Good 1.9% |
| Hungarians | 71.7 /100 | #158 | Good 1.9% |
| Slovenes | 70.2 /100 | #159 | Good 1.9% |
| Welsh | 69.7 /100 | #160 | Good 1.9% |
| Immigrants | Middle Africa | 68.8 /100 | #161 | Good 1.9% |
| Irish | 67.5 /100 | #162 | Good 1.9% |
| Czechs | 67.3 /100 | #163 | Good 1.9% |