Immigrants from Europe vs Slavic Doctorate Degree
COMPARE
Immigrants from Europe
Slavic
Doctorate Degree
Doctorate Degree Comparison
Immigrants from Europe
Slavs
2.3%
DOCTORATE DEGREE
99.9/ 100
METRIC RATING
62nd/ 347
METRIC RANK
1.9%
DOCTORATE DEGREE
72.4/ 100
METRIC RATING
156th/ 347
METRIC RANK
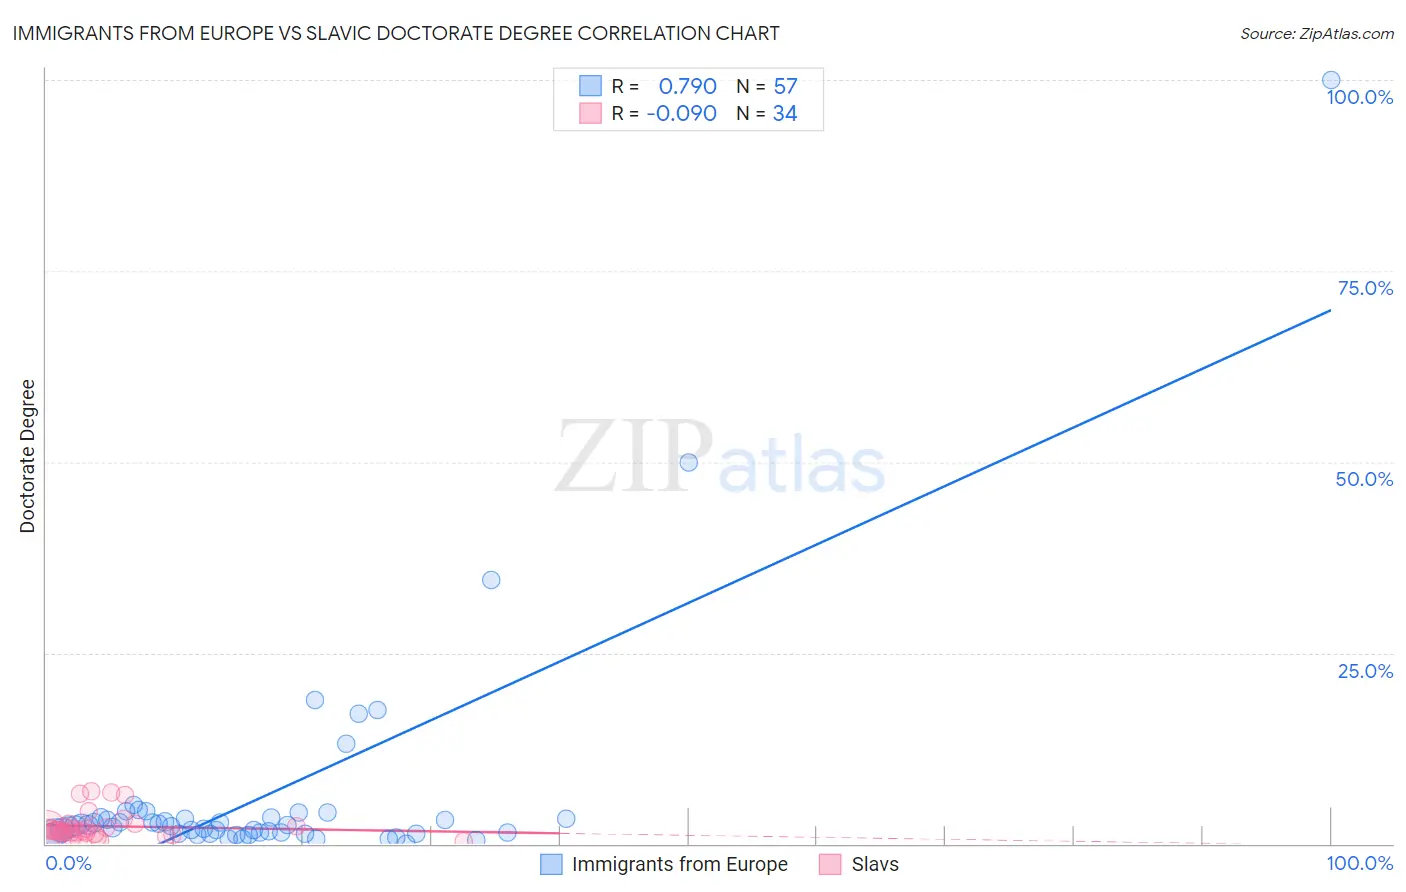
Immigrants from Europe vs Slavic Doctorate Degree Correlation Chart
The statistical analysis conducted on geographies consisting of 532,096,533 people shows a strong positive correlation between the proportion of Immigrants from Europe and percentage of population with at least doctorate degree education in the United States with a correlation coefficient (R) of 0.790 and weighted average of 2.3%. Similarly, the statistical analysis conducted on geographies consisting of 269,161,958 people shows a slight negative correlation between the proportion of Slavs and percentage of population with at least doctorate degree education in the United States with a correlation coefficient (R) of -0.090 and weighted average of 1.9%, a difference of 21.3%.
Doctorate Degree Correlation Summary
| Measurement | Immigrants from Europe | Slavic |
| Minimum | 0.013% | 0.39% |
| Maximum | 100.0% | 6.8% |
| Range | 100.0% | 6.4% |
| Mean | 6.3% | 2.3% |
| Median | 2.4% | 1.7% |
| Interquartile 25% (IQ1) | 1.4% | 1.3% |
| Interquartile 75% (IQ3) | 3.4% | 2.3% |
| Interquartile Range (IQR) | 2.0% | 1.0% |
| Standard Deviation (Sample) | 15.1% | 1.8% |
| Standard Deviation (Population) | 15.0% | 1.8% |
Similar Demographics by Doctorate Degree
Demographics Similar to Immigrants from Europe by Doctorate Degree
In terms of doctorate degree, the demographic groups most similar to Immigrants from Europe are Laotian (2.3%, a difference of 0.090%), Immigrants from Greece (2.3%, a difference of 0.49%), Bhutanese (2.3%, a difference of 0.52%), Paraguayan (2.3%, a difference of 1.0%), and Argentinean (2.3%, a difference of 1.2%).
| Demographics | Rating | Rank | Doctorate Degree |
| Bolivians | 100.0 /100 | #55 | Exceptional 2.4% |
| Immigrants | Czechoslovakia | 100.0 /100 | #56 | Exceptional 2.4% |
| Immigrants | Ethiopia | 100.0 /100 | #57 | Exceptional 2.4% |
| Ethiopians | 99.9 /100 | #58 | Exceptional 2.3% |
| South Africans | 99.9 /100 | #59 | Exceptional 2.3% |
| Immigrants | Serbia | 99.9 /100 | #60 | Exceptional 2.3% |
| Bhutanese | 99.9 /100 | #61 | Exceptional 2.3% |
| Immigrants | Europe | 99.9 /100 | #62 | Exceptional 2.3% |
| Laotians | 99.9 /100 | #63 | Exceptional 2.3% |
| Immigrants | Greece | 99.9 /100 | #64 | Exceptional 2.3% |
| Paraguayans | 99.9 /100 | #65 | Exceptional 2.3% |
| Argentineans | 99.9 /100 | #66 | Exceptional 2.3% |
| Zimbabweans | 99.8 /100 | #67 | Exceptional 2.3% |
| Immigrants | Kazakhstan | 99.8 /100 | #68 | Exceptional 2.3% |
| Carpatho Rusyns | 99.8 /100 | #69 | Exceptional 2.3% |
Demographics Similar to Slavs by Doctorate Degree
In terms of doctorate degree, the demographic groups most similar to Slavs are Polish (1.9%, a difference of 0.060%), Immigrants from Albania (1.9%, a difference of 0.080%), Danish (1.9%, a difference of 0.090%), Hungarian (1.9%, a difference of 0.11%), and Immigrants from Oceania (1.9%, a difference of 0.30%).
| Demographics | Rating | Rank | Doctorate Degree |
| Basques | 76.9 /100 | #149 | Good 1.9% |
| English | 75.9 /100 | #150 | Good 1.9% |
| Albanians | 74.8 /100 | #151 | Good 1.9% |
| Immigrants | Kenya | 74.3 /100 | #152 | Good 1.9% |
| Immigrants | Oceania | 74.0 /100 | #153 | Good 1.9% |
| Immigrants | Albania | 72.8 /100 | #154 | Good 1.9% |
| Poles | 72.7 /100 | #155 | Good 1.9% |
| Slavs | 72.4 /100 | #156 | Good 1.9% |
| Danes | 71.9 /100 | #157 | Good 1.9% |
| Hungarians | 71.7 /100 | #158 | Good 1.9% |
| Slovenes | 70.2 /100 | #159 | Good 1.9% |
| Welsh | 69.7 /100 | #160 | Good 1.9% |
| Immigrants | Middle Africa | 68.8 /100 | #161 | Good 1.9% |
| Irish | 67.5 /100 | #162 | Good 1.9% |
| Czechs | 67.3 /100 | #163 | Good 1.9% |