Icelander vs Slavic Doctorate Degree
COMPARE
Icelander
Slavic
Doctorate Degree
Doctorate Degree Comparison
Icelanders
Slavs
2.1%
DOCTORATE DEGREE
96.0/ 100
METRIC RATING
118th/ 347
METRIC RANK
1.9%
DOCTORATE DEGREE
72.4/ 100
METRIC RATING
156th/ 347
METRIC RANK
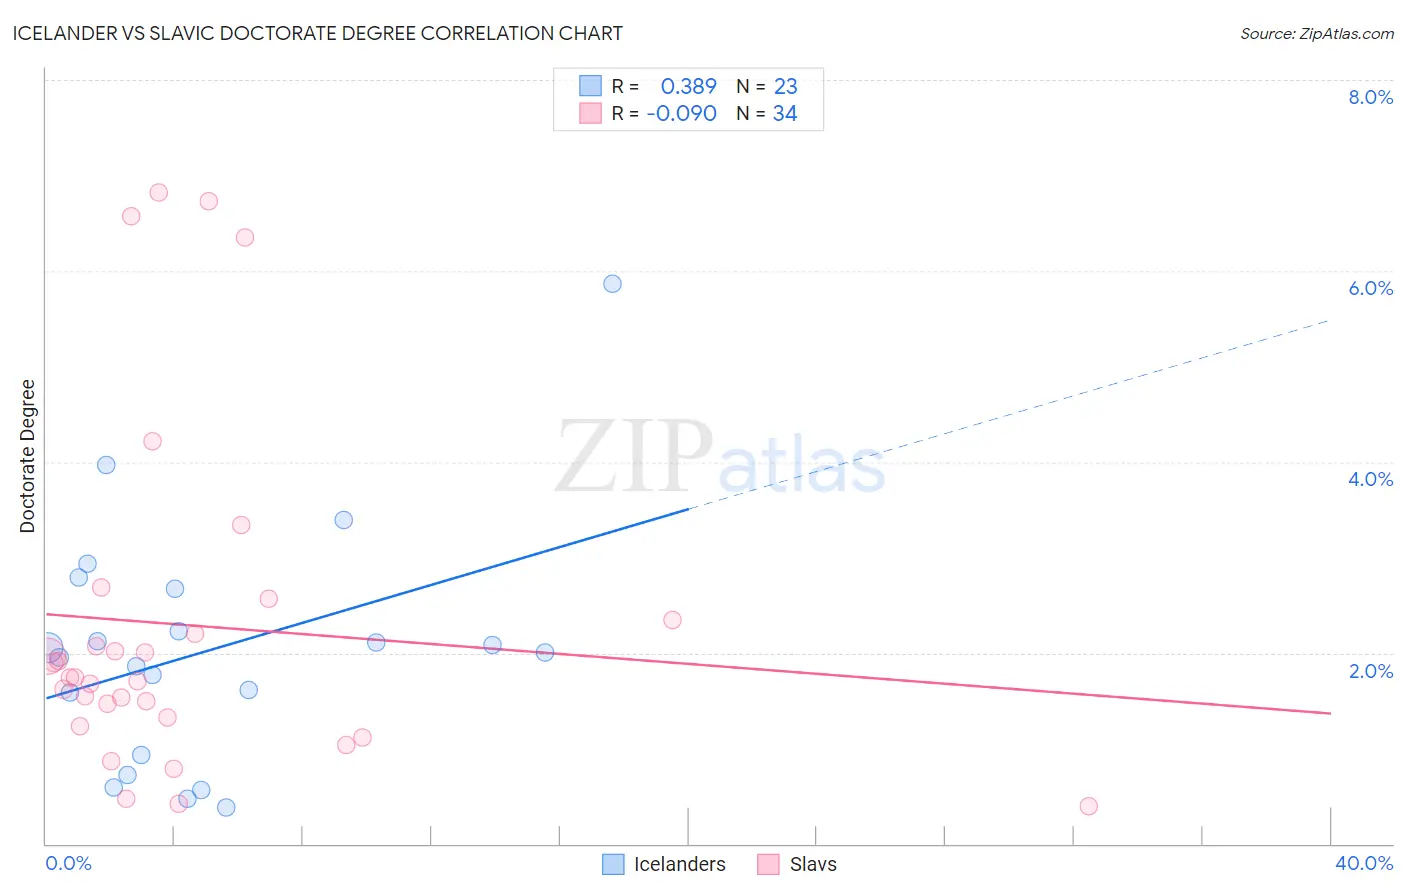
Icelander vs Slavic Doctorate Degree Correlation Chart
The statistical analysis conducted on geographies consisting of 159,042,480 people shows a mild positive correlation between the proportion of Icelanders and percentage of population with at least doctorate degree education in the United States with a correlation coefficient (R) of 0.389 and weighted average of 2.1%. Similarly, the statistical analysis conducted on geographies consisting of 269,161,958 people shows a slight negative correlation between the proportion of Slavs and percentage of population with at least doctorate degree education in the United States with a correlation coefficient (R) of -0.090 and weighted average of 1.9%, a difference of 7.8%.
Doctorate Degree Correlation Summary
| Measurement | Icelander | Slavic |
| Minimum | 0.38% | 0.39% |
| Maximum | 5.9% | 6.8% |
| Range | 5.5% | 6.4% |
| Mean | 2.0% | 2.3% |
| Median | 2.0% | 1.7% |
| Interquartile 25% (IQ1) | 0.93% | 1.3% |
| Interquartile 75% (IQ3) | 2.7% | 2.3% |
| Interquartile Range (IQR) | 1.7% | 1.0% |
| Standard Deviation (Sample) | 1.3% | 1.8% |
| Standard Deviation (Population) | 1.2% | 1.8% |
Similar Demographics by Doctorate Degree
Demographics Similar to Icelanders by Doctorate Degree
In terms of doctorate degree, the demographic groups most similar to Icelanders are Lebanese (2.1%, a difference of 0.040%), Pakistani (2.0%, a difference of 0.13%), Maltese (2.1%, a difference of 0.21%), Immigrants from Morocco (2.0%, a difference of 0.42%), and Taiwanese (2.1%, a difference of 0.67%).
| Demographics | Rating | Rank | Doctorate Degree |
| Immigrants | Pakistan | 97.1 /100 | #111 | Exceptional 2.1% |
| Syrians | 97.1 /100 | #112 | Exceptional 2.1% |
| Immigrants | Italy | 96.9 /100 | #113 | Exceptional 2.1% |
| Immigrants | Croatia | 96.8 /100 | #114 | Exceptional 2.1% |
| Taiwanese | 96.7 /100 | #115 | Exceptional 2.1% |
| Maltese | 96.2 /100 | #116 | Exceptional 2.1% |
| Lebanese | 96.0 /100 | #117 | Exceptional 2.1% |
| Icelanders | 96.0 /100 | #118 | Exceptional 2.1% |
| Pakistanis | 95.8 /100 | #119 | Exceptional 2.0% |
| Immigrants | Morocco | 95.5 /100 | #120 | Exceptional 2.0% |
| Immigrants | Jordan | 94.8 /100 | #121 | Exceptional 2.0% |
| Immigrants | Southern Europe | 94.7 /100 | #122 | Exceptional 2.0% |
| Croatians | 94.0 /100 | #123 | Exceptional 2.0% |
| Ute | 93.2 /100 | #124 | Exceptional 2.0% |
| Moroccans | 93.0 /100 | #125 | Exceptional 2.0% |
Demographics Similar to Slavs by Doctorate Degree
In terms of doctorate degree, the demographic groups most similar to Slavs are Polish (1.9%, a difference of 0.060%), Immigrants from Albania (1.9%, a difference of 0.080%), Danish (1.9%, a difference of 0.090%), Hungarian (1.9%, a difference of 0.11%), and Immigrants from Oceania (1.9%, a difference of 0.30%).
| Demographics | Rating | Rank | Doctorate Degree |
| Basques | 76.9 /100 | #149 | Good 1.9% |
| English | 75.9 /100 | #150 | Good 1.9% |
| Albanians | 74.8 /100 | #151 | Good 1.9% |
| Immigrants | Kenya | 74.3 /100 | #152 | Good 1.9% |
| Immigrants | Oceania | 74.0 /100 | #153 | Good 1.9% |
| Immigrants | Albania | 72.8 /100 | #154 | Good 1.9% |
| Poles | 72.7 /100 | #155 | Good 1.9% |
| Slavs | 72.4 /100 | #156 | Good 1.9% |
| Danes | 71.9 /100 | #157 | Good 1.9% |
| Hungarians | 71.7 /100 | #158 | Good 1.9% |
| Slovenes | 70.2 /100 | #159 | Good 1.9% |
| Welsh | 69.7 /100 | #160 | Good 1.9% |
| Immigrants | Middle Africa | 68.8 /100 | #161 | Good 1.9% |
| Irish | 67.5 /100 | #162 | Good 1.9% |
| Czechs | 67.3 /100 | #163 | Good 1.9% |