Immigrants from Sudan vs Cajun Bachelor's Degree
COMPARE
Immigrants from Sudan
Cajun
Bachelor's Degree
Bachelor's Degree Comparison
Immigrants from Sudan
Cajuns
39.4%
BACHELOR'S DEGREE
84.5/ 100
METRIC RATING
139th/ 347
METRIC RANK
29.6%
BACHELOR'S DEGREE
0.0/ 100
METRIC RATING
308th/ 347
METRIC RANK
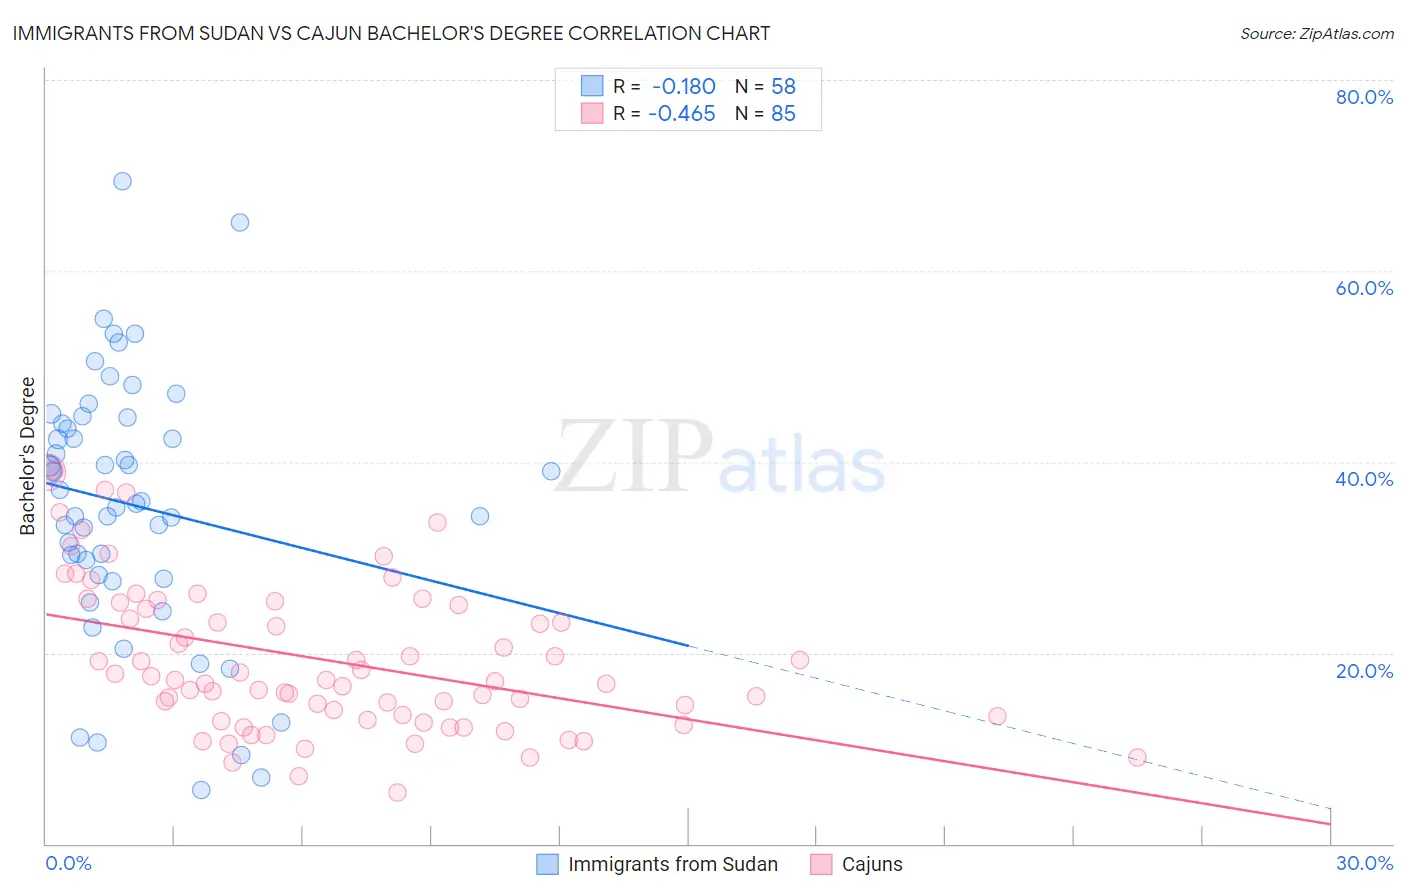
Immigrants from Sudan vs Cajun Bachelor's Degree Correlation Chart
The statistical analysis conducted on geographies consisting of 118,968,853 people shows a poor negative correlation between the proportion of Immigrants from Sudan and percentage of population with at least bachelor's degree education in the United States with a correlation coefficient (R) of -0.180 and weighted average of 39.4%. Similarly, the statistical analysis conducted on geographies consisting of 149,707,155 people shows a moderate negative correlation between the proportion of Cajuns and percentage of population with at least bachelor's degree education in the United States with a correlation coefficient (R) of -0.465 and weighted average of 29.6%, a difference of 32.9%.
Bachelor's Degree Correlation Summary
| Measurement | Immigrants from Sudan | Cajun |
| Minimum | 5.7% | 5.4% |
| Maximum | 69.4% | 39.1% |
| Range | 63.7% | 33.8% |
| Mean | 35.5% | 19.2% |
| Median | 35.7% | 17.1% |
| Interquartile 25% (IQ1) | 28.1% | 13.2% |
| Interquartile 75% (IQ3) | 44.0% | 25.1% |
| Interquartile Range (IQR) | 15.8% | 11.9% |
| Standard Deviation (Sample) | 13.6% | 7.8% |
| Standard Deviation (Population) | 13.4% | 7.8% |
Similar Demographics by Bachelor's Degree
Demographics Similar to Immigrants from Sudan by Bachelor's Degree
In terms of bachelor's degree, the demographic groups most similar to Immigrants from Sudan are Immigrants from Armenia (39.4%, a difference of 0.070%), South American Indian (39.3%, a difference of 0.16%), European (39.5%, a difference of 0.20%), Icelander (39.5%, a difference of 0.37%), and Immigrants from North Macedonia (39.2%, a difference of 0.48%).
| Demographics | Rating | Rank | Bachelor's Degree |
| Taiwanese | 91.1 /100 | #132 | Exceptional 40.0% |
| Immigrants | Southern Europe | 91.1 /100 | #133 | Exceptional 40.0% |
| Assyrians/Chaldeans/Syriacs | 89.4 /100 | #134 | Excellent 39.8% |
| Luxembourgers | 89.1 /100 | #135 | Excellent 39.8% |
| Pakistanis | 88.2 /100 | #136 | Excellent 39.7% |
| Icelanders | 86.5 /100 | #137 | Excellent 39.5% |
| Europeans | 85.6 /100 | #138 | Excellent 39.5% |
| Immigrants | Sudan | 84.5 /100 | #139 | Excellent 39.4% |
| Immigrants | Armenia | 84.1 /100 | #140 | Excellent 39.4% |
| South American Indians | 83.6 /100 | #141 | Excellent 39.3% |
| Immigrants | North Macedonia | 81.6 /100 | #142 | Excellent 39.2% |
| Poles | 79.8 /100 | #143 | Good 39.1% |
| Immigrants | Afghanistan | 79.7 /100 | #144 | Good 39.1% |
| Slovenes | 79.5 /100 | #145 | Good 39.1% |
| Swedes | 79.2 /100 | #146 | Good 39.1% |
Demographics Similar to Cajuns by Bachelor's Degree
In terms of bachelor's degree, the demographic groups most similar to Cajuns are Hispanic or Latino (29.6%, a difference of 0.18%), Cheyenne (29.4%, a difference of 0.65%), Choctaw (29.4%, a difference of 0.72%), Seminole (29.4%, a difference of 0.78%), and Nepalese (29.9%, a difference of 0.86%).
| Demographics | Rating | Rank | Bachelor's Degree |
| Immigrants | Cuba | 0.0 /100 | #301 | Tragic 30.3% |
| Mexican American Indians | 0.0 /100 | #302 | Tragic 30.2% |
| Bangladeshis | 0.0 /100 | #303 | Tragic 30.2% |
| Cherokee | 0.0 /100 | #304 | Tragic 30.2% |
| Immigrants | Latin America | 0.0 /100 | #305 | Tragic 30.1% |
| Immigrants | Yemen | 0.0 /100 | #306 | Tragic 29.9% |
| Nepalese | 0.0 /100 | #307 | Tragic 29.9% |
| Cajuns | 0.0 /100 | #308 | Tragic 29.6% |
| Hispanics or Latinos | 0.0 /100 | #309 | Tragic 29.6% |
| Cheyenne | 0.0 /100 | #310 | Tragic 29.4% |
| Choctaw | 0.0 /100 | #311 | Tragic 29.4% |
| Seminole | 0.0 /100 | #312 | Tragic 29.4% |
| Alaska Natives | 0.0 /100 | #313 | Tragic 29.4% |
| Shoshone | 0.0 /100 | #314 | Tragic 29.3% |
| Immigrants | Cabo Verde | 0.0 /100 | #315 | Tragic 29.2% |