Immigrants from Sudan vs Barbadian Bachelor's Degree
COMPARE
Immigrants from Sudan
Barbadian
Bachelor's Degree
Bachelor's Degree Comparison
Immigrants from Sudan
Barbadians
39.4%
BACHELOR'S DEGREE
84.5/ 100
METRIC RATING
139th/ 347
METRIC RANK
36.1%
BACHELOR'S DEGREE
13.5/ 100
METRIC RATING
216th/ 347
METRIC RANK
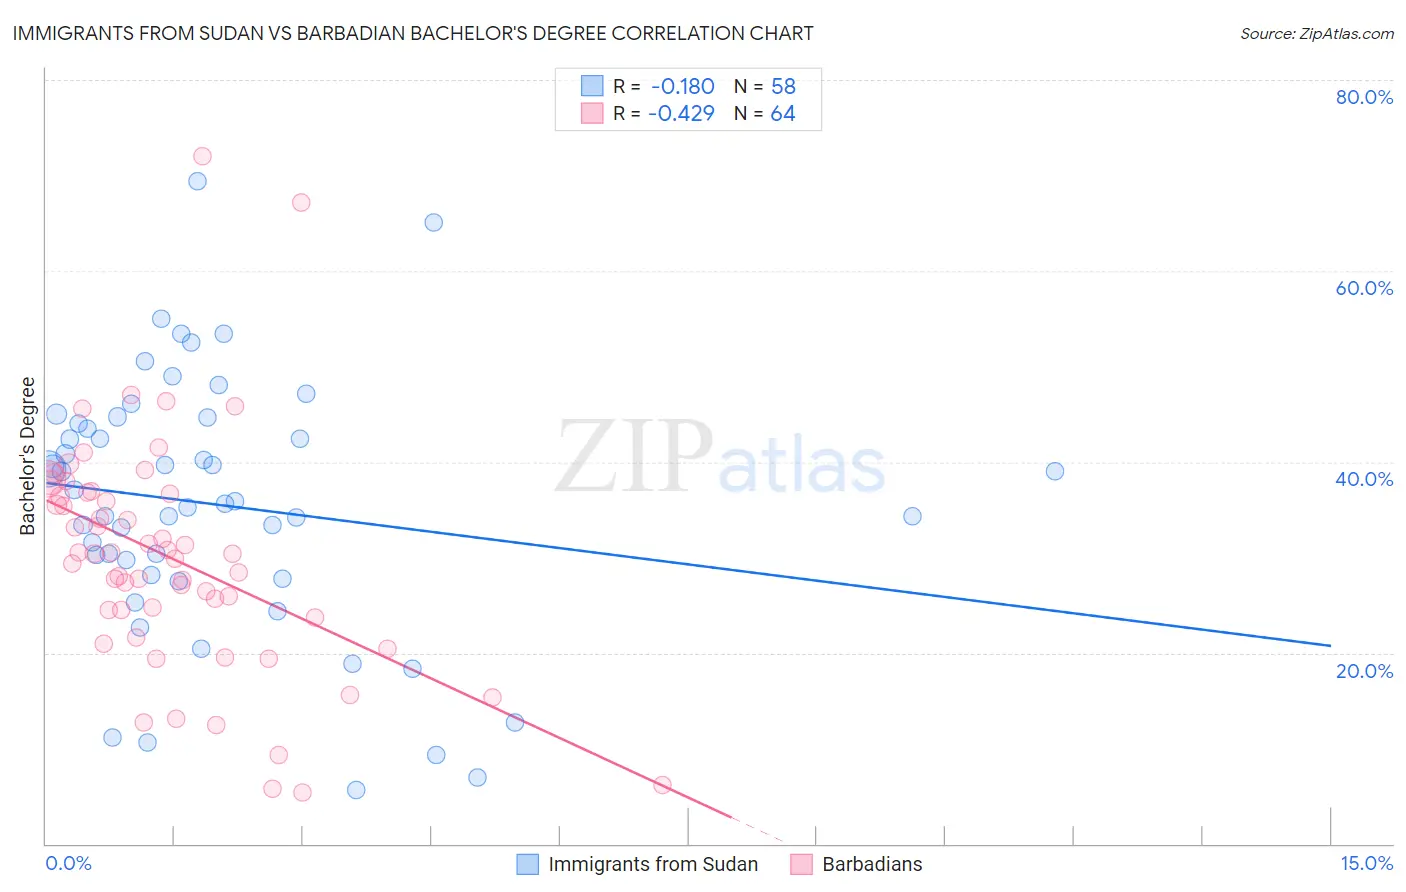
Immigrants from Sudan vs Barbadian Bachelor's Degree Correlation Chart
The statistical analysis conducted on geographies consisting of 118,968,853 people shows a poor negative correlation between the proportion of Immigrants from Sudan and percentage of population with at least bachelor's degree education in the United States with a correlation coefficient (R) of -0.180 and weighted average of 39.4%. Similarly, the statistical analysis conducted on geographies consisting of 141,300,746 people shows a moderate negative correlation between the proportion of Barbadians and percentage of population with at least bachelor's degree education in the United States with a correlation coefficient (R) of -0.429 and weighted average of 36.1%, a difference of 9.0%.
Bachelor's Degree Correlation Summary
| Measurement | Immigrants from Sudan | Barbadian |
| Minimum | 5.7% | 5.4% |
| Maximum | 69.4% | 72.0% |
| Range | 63.7% | 66.6% |
| Mean | 35.5% | 30.0% |
| Median | 35.7% | 30.3% |
| Interquartile 25% (IQ1) | 28.1% | 24.1% |
| Interquartile 75% (IQ3) | 44.0% | 36.8% |
| Interquartile Range (IQR) | 15.8% | 12.7% |
| Standard Deviation (Sample) | 13.6% | 12.3% |
| Standard Deviation (Population) | 13.4% | 12.2% |
Similar Demographics by Bachelor's Degree
Demographics Similar to Immigrants from Sudan by Bachelor's Degree
In terms of bachelor's degree, the demographic groups most similar to Immigrants from Sudan are Immigrants from Armenia (39.4%, a difference of 0.070%), South American Indian (39.3%, a difference of 0.16%), European (39.5%, a difference of 0.20%), Icelander (39.5%, a difference of 0.37%), and Immigrants from North Macedonia (39.2%, a difference of 0.48%).
| Demographics | Rating | Rank | Bachelor's Degree |
| Taiwanese | 91.1 /100 | #132 | Exceptional 40.0% |
| Immigrants | Southern Europe | 91.1 /100 | #133 | Exceptional 40.0% |
| Assyrians/Chaldeans/Syriacs | 89.4 /100 | #134 | Excellent 39.8% |
| Luxembourgers | 89.1 /100 | #135 | Excellent 39.8% |
| Pakistanis | 88.2 /100 | #136 | Excellent 39.7% |
| Icelanders | 86.5 /100 | #137 | Excellent 39.5% |
| Europeans | 85.6 /100 | #138 | Excellent 39.5% |
| Immigrants | Sudan | 84.5 /100 | #139 | Excellent 39.4% |
| Immigrants | Armenia | 84.1 /100 | #140 | Excellent 39.4% |
| South American Indians | 83.6 /100 | #141 | Excellent 39.3% |
| Immigrants | North Macedonia | 81.6 /100 | #142 | Excellent 39.2% |
| Poles | 79.8 /100 | #143 | Good 39.1% |
| Immigrants | Afghanistan | 79.7 /100 | #144 | Good 39.1% |
| Slovenes | 79.5 /100 | #145 | Good 39.1% |
| Swedes | 79.2 /100 | #146 | Good 39.1% |
Demographics Similar to Barbadians by Bachelor's Degree
In terms of bachelor's degree, the demographic groups most similar to Barbadians are Immigrants from Western Africa (36.1%, a difference of 0.060%), German (36.1%, a difference of 0.090%), Immigrants from Panama (36.2%, a difference of 0.16%), German Russian (35.8%, a difference of 0.81%), and Immigrants from Philippines (36.4%, a difference of 0.84%).
| Demographics | Rating | Rank | Bachelor's Degree |
| Panamanians | 18.8 /100 | #209 | Poor 36.5% |
| French | 18.6 /100 | #210 | Poor 36.5% |
| Scotch-Irish | 18.3 /100 | #211 | Poor 36.4% |
| Immigrants | Philippines | 17.8 /100 | #212 | Poor 36.4% |
| Immigrants | Panama | 14.2 /100 | #213 | Poor 36.2% |
| Germans | 13.9 /100 | #214 | Poor 36.1% |
| Immigrants | Western Africa | 13.8 /100 | #215 | Poor 36.1% |
| Barbadians | 13.5 /100 | #216 | Poor 36.1% |
| German Russians | 10.2 /100 | #217 | Poor 35.8% |
| Sub-Saharan Africans | 9.8 /100 | #218 | Tragic 35.8% |
| West Indians | 9.7 /100 | #219 | Tragic 35.8% |
| Spanish | 9.6 /100 | #220 | Tragic 35.8% |
| Dutch | 9.2 /100 | #221 | Tragic 35.7% |
| Trinidadians and Tobagonians | 8.8 /100 | #222 | Tragic 35.7% |
| French Canadians | 8.3 /100 | #223 | Tragic 35.6% |