Immigrants from Senegal vs Cajun Bachelor's Degree
COMPARE
Immigrants from Senegal
Cajun
Bachelor's Degree
Bachelor's Degree Comparison
Immigrants from Senegal
Cajuns
37.6%
BACHELOR'S DEGREE
43.8/ 100
METRIC RATING
181st/ 347
METRIC RANK
29.6%
BACHELOR'S DEGREE
0.0/ 100
METRIC RATING
308th/ 347
METRIC RANK
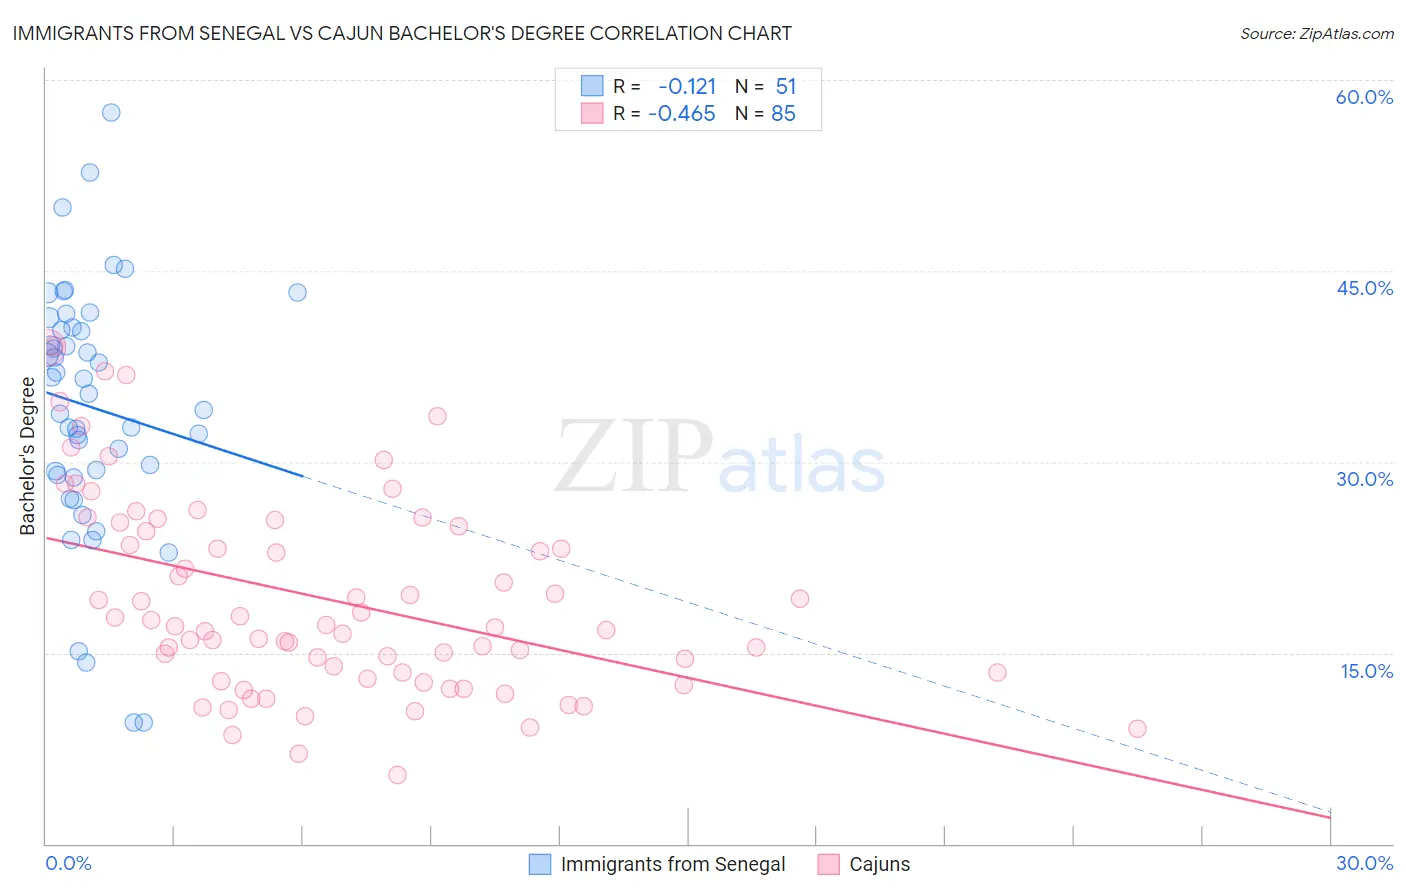
Immigrants from Senegal vs Cajun Bachelor's Degree Correlation Chart
The statistical analysis conducted on geographies consisting of 90,125,204 people shows a poor negative correlation between the proportion of Immigrants from Senegal and percentage of population with at least bachelor's degree education in the United States with a correlation coefficient (R) of -0.121 and weighted average of 37.6%. Similarly, the statistical analysis conducted on geographies consisting of 149,707,155 people shows a moderate negative correlation between the proportion of Cajuns and percentage of population with at least bachelor's degree education in the United States with a correlation coefficient (R) of -0.465 and weighted average of 29.6%, a difference of 26.9%.
Bachelor's Degree Correlation Summary
| Measurement | Immigrants from Senegal | Cajun |
| Minimum | 9.5% | 5.4% |
| Maximum | 57.5% | 39.1% |
| Range | 48.0% | 33.8% |
| Mean | 34.3% | 19.2% |
| Median | 35.4% | 17.1% |
| Interquartile 25% (IQ1) | 29.0% | 13.2% |
| Interquartile 75% (IQ3) | 40.6% | 25.1% |
| Interquartile Range (IQR) | 11.6% | 11.9% |
| Standard Deviation (Sample) | 9.9% | 7.8% |
| Standard Deviation (Population) | 9.8% | 7.8% |
Similar Demographics by Bachelor's Degree
Demographics Similar to Immigrants from Senegal by Bachelor's Degree
In terms of bachelor's degree, the demographic groups most similar to Immigrants from Senegal are Immigrants from Bosnia and Herzegovina (37.6%, a difference of 0.030%), Irish (37.6%, a difference of 0.050%), Immigrants from Colombia (37.7%, a difference of 0.16%), Senegalese (37.5%, a difference of 0.16%), and Scandinavian (37.5%, a difference of 0.20%).
| Demographics | Rating | Rank | Bachelor's Degree |
| Immigrants | Bangladesh | 50.0 /100 | #174 | Average 37.8% |
| Immigrants | Uruguay | 48.3 /100 | #175 | Average 37.8% |
| Costa Ricans | 47.6 /100 | #176 | Average 37.7% |
| Basques | 47.4 /100 | #177 | Average 37.7% |
| Immigrants | Cameroon | 46.8 /100 | #178 | Average 37.7% |
| Immigrants | Colombia | 45.4 /100 | #179 | Average 37.7% |
| Irish | 44.3 /100 | #180 | Average 37.6% |
| Immigrants | Senegal | 43.8 /100 | #181 | Average 37.6% |
| Immigrants | Bosnia and Herzegovina | 43.4 /100 | #182 | Average 37.6% |
| Senegalese | 42.2 /100 | #183 | Average 37.5% |
| Scandinavians | 41.7 /100 | #184 | Average 37.5% |
| Immigrants | Peru | 41.3 /100 | #185 | Average 37.5% |
| Norwegians | 40.4 /100 | #186 | Average 37.5% |
| English | 39.7 /100 | #187 | Fair 37.4% |
| Immigrants | Oceania | 37.3 /100 | #188 | Fair 37.3% |
Demographics Similar to Cajuns by Bachelor's Degree
In terms of bachelor's degree, the demographic groups most similar to Cajuns are Hispanic or Latino (29.6%, a difference of 0.18%), Cheyenne (29.4%, a difference of 0.65%), Choctaw (29.4%, a difference of 0.72%), Seminole (29.4%, a difference of 0.78%), and Nepalese (29.9%, a difference of 0.86%).
| Demographics | Rating | Rank | Bachelor's Degree |
| Immigrants | Cuba | 0.0 /100 | #301 | Tragic 30.3% |
| Mexican American Indians | 0.0 /100 | #302 | Tragic 30.2% |
| Bangladeshis | 0.0 /100 | #303 | Tragic 30.2% |
| Cherokee | 0.0 /100 | #304 | Tragic 30.2% |
| Immigrants | Latin America | 0.0 /100 | #305 | Tragic 30.1% |
| Immigrants | Yemen | 0.0 /100 | #306 | Tragic 29.9% |
| Nepalese | 0.0 /100 | #307 | Tragic 29.9% |
| Cajuns | 0.0 /100 | #308 | Tragic 29.6% |
| Hispanics or Latinos | 0.0 /100 | #309 | Tragic 29.6% |
| Cheyenne | 0.0 /100 | #310 | Tragic 29.4% |
| Choctaw | 0.0 /100 | #311 | Tragic 29.4% |
| Seminole | 0.0 /100 | #312 | Tragic 29.4% |
| Alaska Natives | 0.0 /100 | #313 | Tragic 29.4% |
| Shoshone | 0.0 /100 | #314 | Tragic 29.3% |
| Immigrants | Cabo Verde | 0.0 /100 | #315 | Tragic 29.2% |