Immigrants from Sudan vs Cape Verdean Bachelor's Degree
COMPARE
Immigrants from Sudan
Cape Verdean
Bachelor's Degree
Bachelor's Degree Comparison
Immigrants from Sudan
Cape Verdeans
39.4%
BACHELOR'S DEGREE
84.5/ 100
METRIC RATING
139th/ 347
METRIC RANK
30.9%
BACHELOR'S DEGREE
0.1/ 100
METRIC RATING
293rd/ 347
METRIC RANK
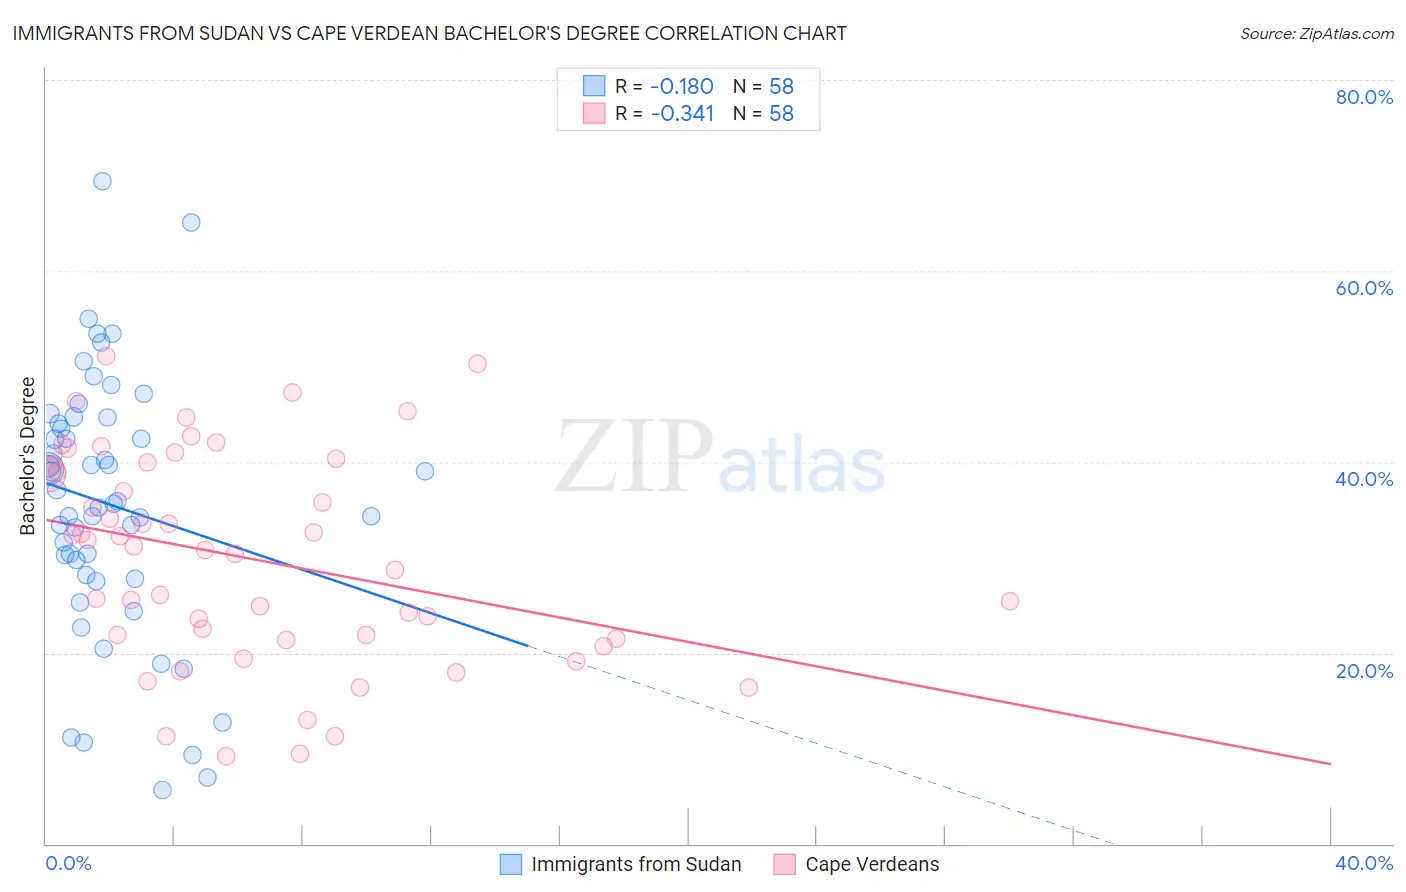
Immigrants from Sudan vs Cape Verdean Bachelor's Degree Correlation Chart
The statistical analysis conducted on geographies consisting of 118,968,853 people shows a poor negative correlation between the proportion of Immigrants from Sudan and percentage of population with at least bachelor's degree education in the United States with a correlation coefficient (R) of -0.180 and weighted average of 39.4%. Similarly, the statistical analysis conducted on geographies consisting of 107,579,192 people shows a mild negative correlation between the proportion of Cape Verdeans and percentage of population with at least bachelor's degree education in the United States with a correlation coefficient (R) of -0.341 and weighted average of 30.9%, a difference of 27.6%.
Bachelor's Degree Correlation Summary
| Measurement | Immigrants from Sudan | Cape Verdean |
| Minimum | 5.7% | 9.1% |
| Maximum | 69.4% | 51.0% |
| Range | 63.7% | 41.9% |
| Mean | 35.5% | 29.9% |
| Median | 35.7% | 31.0% |
| Interquartile 25% (IQ1) | 28.1% | 21.5% |
| Interquartile 75% (IQ3) | 44.0% | 39.7% |
| Interquartile Range (IQR) | 15.8% | 18.2% |
| Standard Deviation (Sample) | 13.6% | 11.0% |
| Standard Deviation (Population) | 13.4% | 10.9% |
Similar Demographics by Bachelor's Degree
Demographics Similar to Immigrants from Sudan by Bachelor's Degree
In terms of bachelor's degree, the demographic groups most similar to Immigrants from Sudan are Immigrants from Armenia (39.4%, a difference of 0.070%), South American Indian (39.3%, a difference of 0.16%), European (39.5%, a difference of 0.20%), Icelander (39.5%, a difference of 0.37%), and Immigrants from North Macedonia (39.2%, a difference of 0.48%).
| Demographics | Rating | Rank | Bachelor's Degree |
| Taiwanese | 91.1 /100 | #132 | Exceptional 40.0% |
| Immigrants | Southern Europe | 91.1 /100 | #133 | Exceptional 40.0% |
| Assyrians/Chaldeans/Syriacs | 89.4 /100 | #134 | Excellent 39.8% |
| Luxembourgers | 89.1 /100 | #135 | Excellent 39.8% |
| Pakistanis | 88.2 /100 | #136 | Excellent 39.7% |
| Icelanders | 86.5 /100 | #137 | Excellent 39.5% |
| Europeans | 85.6 /100 | #138 | Excellent 39.5% |
| Immigrants | Sudan | 84.5 /100 | #139 | Excellent 39.4% |
| Immigrants | Armenia | 84.1 /100 | #140 | Excellent 39.4% |
| South American Indians | 83.6 /100 | #141 | Excellent 39.3% |
| Immigrants | North Macedonia | 81.6 /100 | #142 | Excellent 39.2% |
| Poles | 79.8 /100 | #143 | Good 39.1% |
| Immigrants | Afghanistan | 79.7 /100 | #144 | Good 39.1% |
| Slovenes | 79.5 /100 | #145 | Good 39.1% |
| Swedes | 79.2 /100 | #146 | Good 39.1% |
Demographics Similar to Cape Verdeans by Bachelor's Degree
In terms of bachelor's degree, the demographic groups most similar to Cape Verdeans are Ute (30.9%, a difference of 0.090%), Black/African American (30.9%, a difference of 0.18%), Immigrants from Honduras (30.9%, a difference of 0.21%), Puerto Rican (31.0%, a difference of 0.26%), and Guatemalan (31.0%, a difference of 0.40%).
| Demographics | Rating | Rank | Bachelor's Degree |
| Immigrants | El Salvador | 0.1 /100 | #286 | Tragic 31.3% |
| Ottawa | 0.1 /100 | #287 | Tragic 31.1% |
| Guatemalans | 0.1 /100 | #288 | Tragic 31.0% |
| Puerto Ricans | 0.1 /100 | #289 | Tragic 31.0% |
| Immigrants | Honduras | 0.1 /100 | #290 | Tragic 30.9% |
| Blacks/African Americans | 0.1 /100 | #291 | Tragic 30.9% |
| Ute | 0.1 /100 | #292 | Tragic 30.9% |
| Cape Verdeans | 0.1 /100 | #293 | Tragic 30.9% |
| Immigrants | Guatemala | 0.0 /100 | #294 | Tragic 30.8% |
| Immigrants | Dominican Republic | 0.0 /100 | #295 | Tragic 30.7% |
| Puget Sound Salish | 0.0 /100 | #296 | Tragic 30.7% |
| Immigrants | Haiti | 0.0 /100 | #297 | Tragic 30.6% |
| Chippewa | 0.0 /100 | #298 | Tragic 30.6% |
| Chickasaw | 0.0 /100 | #299 | Tragic 30.4% |
| Immigrants | Micronesia | 0.0 /100 | #300 | Tragic 30.4% |