Croatian vs Barbadian Bachelor's Degree
COMPARE
Croatian
Barbadian
Bachelor's Degree
Bachelor's Degree Comparison
Croatians
Barbadians
40.6%
BACHELOR'S DEGREE
95.5/ 100
METRIC RATING
118th/ 347
METRIC RANK
36.1%
BACHELOR'S DEGREE
13.5/ 100
METRIC RATING
216th/ 347
METRIC RANK
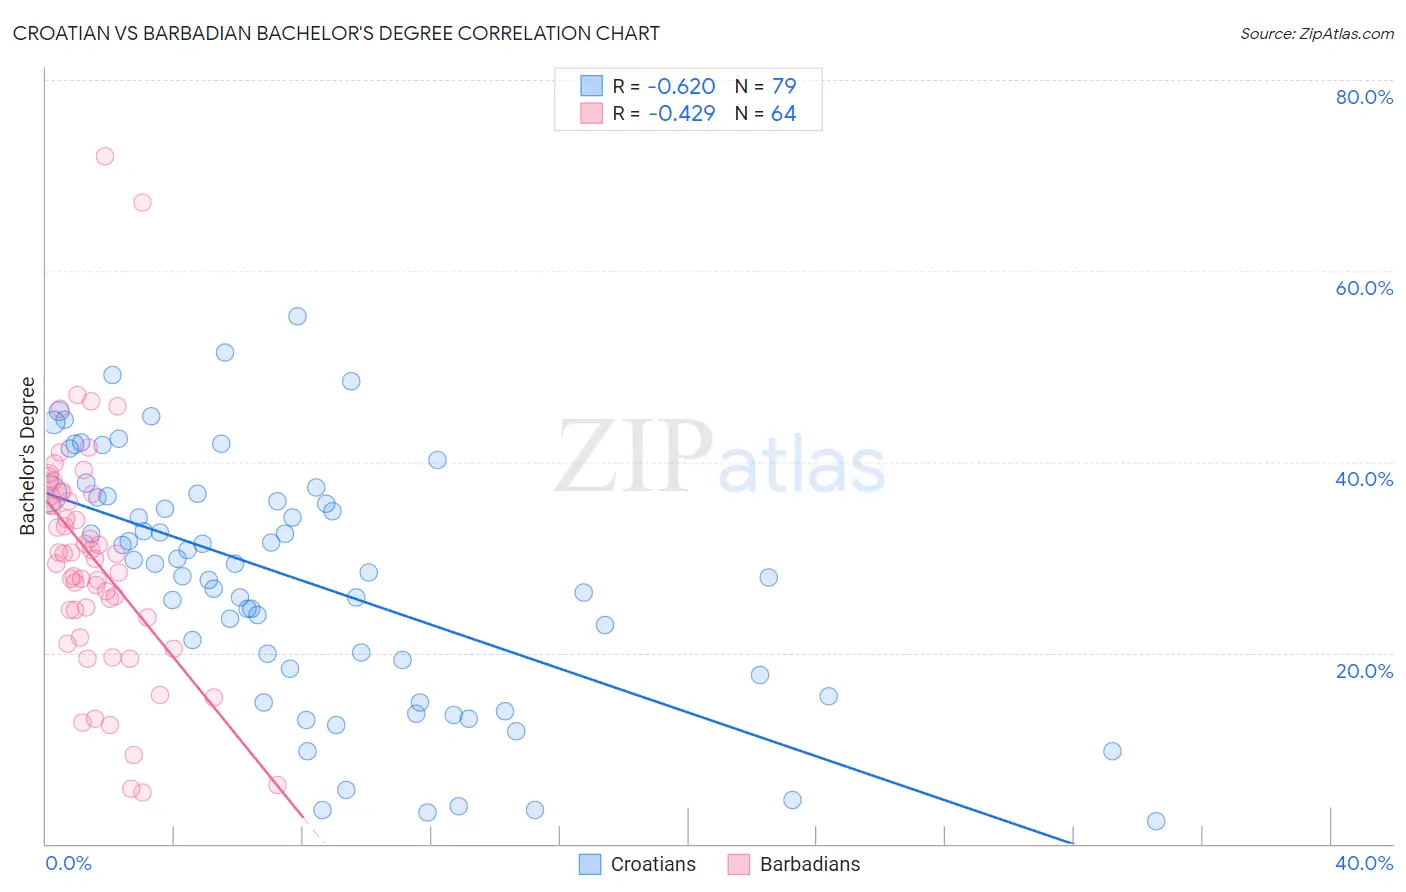
Croatian vs Barbadian Bachelor's Degree Correlation Chart
The statistical analysis conducted on geographies consisting of 375,700,831 people shows a significant negative correlation between the proportion of Croatians and percentage of population with at least bachelor's degree education in the United States with a correlation coefficient (R) of -0.620 and weighted average of 40.6%. Similarly, the statistical analysis conducted on geographies consisting of 141,300,746 people shows a moderate negative correlation between the proportion of Barbadians and percentage of population with at least bachelor's degree education in the United States with a correlation coefficient (R) of -0.429 and weighted average of 36.1%, a difference of 12.5%.
Bachelor's Degree Correlation Summary
| Measurement | Croatian | Barbadian |
| Minimum | 2.3% | 5.4% |
| Maximum | 55.2% | 72.0% |
| Range | 52.9% | 66.6% |
| Mean | 27.5% | 30.0% |
| Median | 29.3% | 30.3% |
| Interquartile 25% (IQ1) | 17.6% | 24.1% |
| Interquartile 75% (IQ3) | 36.5% | 36.8% |
| Interquartile Range (IQR) | 18.8% | 12.7% |
| Standard Deviation (Sample) | 12.8% | 12.3% |
| Standard Deviation (Population) | 12.8% | 12.2% |
Similar Demographics by Bachelor's Degree
Demographics Similar to Croatians by Bachelor's Degree
In terms of bachelor's degree, the demographic groups most similar to Croatians are Austrian (40.6%, a difference of 0.020%), Immigrants from Uganda (40.7%, a difference of 0.12%), Palestinian (40.7%, a difference of 0.17%), Immigrants from Syria (40.5%, a difference of 0.32%), and Venezuelan (40.5%, a difference of 0.39%).
| Demographics | Rating | Rank | Bachelor's Degree |
| Immigrants | Chile | 96.4 /100 | #111 | Exceptional 40.8% |
| Ugandans | 96.3 /100 | #112 | Exceptional 40.8% |
| Brazilians | 96.3 /100 | #113 | Exceptional 40.8% |
| Afghans | 96.2 /100 | #114 | Exceptional 40.8% |
| Palestinians | 95.8 /100 | #115 | Exceptional 40.7% |
| Immigrants | Uganda | 95.7 /100 | #116 | Exceptional 40.7% |
| Austrians | 95.5 /100 | #117 | Exceptional 40.6% |
| Croatians | 95.5 /100 | #118 | Exceptional 40.6% |
| Immigrants | Syria | 94.9 /100 | #119 | Exceptional 40.5% |
| Venezuelans | 94.7 /100 | #120 | Exceptional 40.5% |
| Moroccans | 94.6 /100 | #121 | Exceptional 40.5% |
| Immigrants | Albania | 94.4 /100 | #122 | Exceptional 40.4% |
| Lebanese | 94.3 /100 | #123 | Exceptional 40.4% |
| Immigrants | Eritrea | 94.3 /100 | #124 | Exceptional 40.4% |
| British | 94.2 /100 | #125 | Exceptional 40.4% |
Demographics Similar to Barbadians by Bachelor's Degree
In terms of bachelor's degree, the demographic groups most similar to Barbadians are Immigrants from Western Africa (36.1%, a difference of 0.060%), German (36.1%, a difference of 0.090%), Immigrants from Panama (36.2%, a difference of 0.16%), German Russian (35.8%, a difference of 0.81%), and Immigrants from Philippines (36.4%, a difference of 0.84%).
| Demographics | Rating | Rank | Bachelor's Degree |
| Panamanians | 18.8 /100 | #209 | Poor 36.5% |
| French | 18.6 /100 | #210 | Poor 36.5% |
| Scotch-Irish | 18.3 /100 | #211 | Poor 36.4% |
| Immigrants | Philippines | 17.8 /100 | #212 | Poor 36.4% |
| Immigrants | Panama | 14.2 /100 | #213 | Poor 36.2% |
| Germans | 13.9 /100 | #214 | Poor 36.1% |
| Immigrants | Western Africa | 13.8 /100 | #215 | Poor 36.1% |
| Barbadians | 13.5 /100 | #216 | Poor 36.1% |
| German Russians | 10.2 /100 | #217 | Poor 35.8% |
| Sub-Saharan Africans | 9.8 /100 | #218 | Tragic 35.8% |
| West Indians | 9.7 /100 | #219 | Tragic 35.8% |
| Spanish | 9.6 /100 | #220 | Tragic 35.8% |
| Dutch | 9.2 /100 | #221 | Tragic 35.7% |
| Trinidadians and Tobagonians | 8.8 /100 | #222 | Tragic 35.7% |
| French Canadians | 8.3 /100 | #223 | Tragic 35.6% |