Immigrants from Spain vs Czechoslovakian College, 1 year or more
COMPARE
Immigrants from Spain
Czechoslovakian
College, 1 year or more
College, 1 year or more Comparison
Immigrants from Spain
Czechoslovakians
63.4%
COLLEGE, 1 YEAR OR MORE
99.4/ 100
METRIC RATING
64th/ 347
METRIC RANK
59.4%
COLLEGE, 1 YEAR OR MORE
48.3/ 100
METRIC RATING
178th/ 347
METRIC RANK
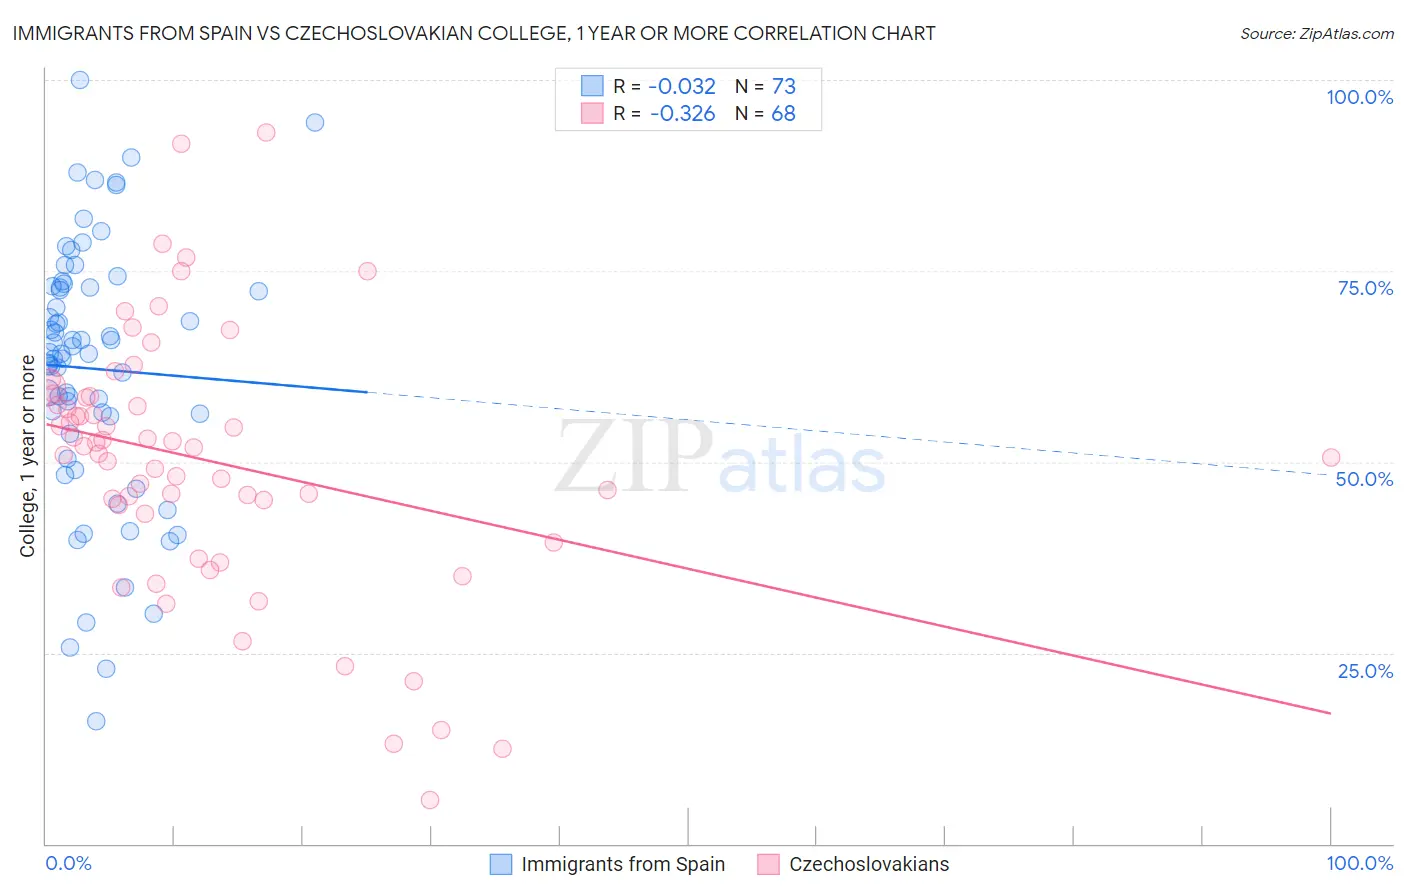
Immigrants from Spain vs Czechoslovakian College, 1 year or more Correlation Chart
The statistical analysis conducted on geographies consisting of 239,683,962 people shows no correlation between the proportion of Immigrants from Spain and percentage of population with at least college, 1 year or more education in the United States with a correlation coefficient (R) of -0.032 and weighted average of 63.4%. Similarly, the statistical analysis conducted on geographies consisting of 368,667,186 people shows a mild negative correlation between the proportion of Czechoslovakians and percentage of population with at least college, 1 year or more education in the United States with a correlation coefficient (R) of -0.326 and weighted average of 59.4%, a difference of 6.8%.
College, 1 year or more Correlation Summary
| Measurement | Immigrants from Spain | Czechoslovakian |
| Minimum | 16.1% | 5.7% |
| Maximum | 100.0% | 93.1% |
| Range | 83.9% | 87.4% |
| Mean | 62.2% | 50.2% |
| Median | 64.1% | 52.0% |
| Interquartile 25% (IQ1) | 54.8% | 43.7% |
| Interquartile 75% (IQ3) | 72.9% | 58.5% |
| Interquartile Range (IQR) | 18.1% | 14.7% |
| Standard Deviation (Sample) | 17.0% | 17.1% |
| Standard Deviation (Population) | 16.9% | 16.9% |
Similar Demographics by College, 1 year or more
Demographics Similar to Immigrants from Spain by College, 1 year or more
In terms of college, 1 year or more, the demographic groups most similar to Immigrants from Spain are Immigrants from Scotland (63.4%, a difference of 0.030%), Maltese (63.4%, a difference of 0.10%), Immigrants from Indonesia (63.5%, a difference of 0.16%), Bolivian (63.5%, a difference of 0.18%), and Immigrants from Europe (63.3%, a difference of 0.21%).
| Demographics | Rating | Rank | College, 1 year or more |
| South Africans | 99.7 /100 | #57 | Exceptional 64.1% |
| Immigrants | Asia | 99.7 /100 | #58 | Exceptional 64.0% |
| Immigrants | Serbia | 99.6 /100 | #59 | Exceptional 63.8% |
| Immigrants | Kazakhstan | 99.5 /100 | #60 | Exceptional 63.6% |
| Bolivians | 99.5 /100 | #61 | Exceptional 63.5% |
| Immigrants | Indonesia | 99.5 /100 | #62 | Exceptional 63.5% |
| Immigrants | Scotland | 99.4 /100 | #63 | Exceptional 63.4% |
| Immigrants | Spain | 99.4 /100 | #64 | Exceptional 63.4% |
| Maltese | 99.3 /100 | #65 | Exceptional 63.4% |
| Immigrants | Europe | 99.3 /100 | #66 | Exceptional 63.3% |
| Immigrants | Romania | 99.3 /100 | #67 | Exceptional 63.3% |
| Immigrants | Greece | 99.3 /100 | #68 | Exceptional 63.3% |
| Immigrants | Zimbabwe | 99.3 /100 | #69 | Exceptional 63.3% |
| Argentineans | 99.2 /100 | #70 | Exceptional 63.2% |
| Immigrants | Canada | 99.1 /100 | #71 | Exceptional 63.1% |
Demographics Similar to Czechoslovakians by College, 1 year or more
In terms of college, 1 year or more, the demographic groups most similar to Czechoslovakians are Tlingit-Haida (59.4%, a difference of 0.0%), Immigrants from Poland (59.4%, a difference of 0.030%), Sri Lankan (59.4%, a difference of 0.040%), Celtic (59.4%, a difference of 0.090%), and Bermudan (59.3%, a difference of 0.090%).
| Demographics | Rating | Rank | College, 1 year or more |
| Immigrants | Albania | 52.3 /100 | #171 | Average 59.5% |
| Immigrants | Sierra Leone | 52.2 /100 | #172 | Average 59.5% |
| Immigrants | Oceania | 51.2 /100 | #173 | Average 59.4% |
| Celtics | 50.0 /100 | #174 | Average 59.4% |
| Sri Lankans | 49.0 /100 | #175 | Average 59.4% |
| Immigrants | Poland | 48.9 /100 | #176 | Average 59.4% |
| Tlingit-Haida | 48.4 /100 | #177 | Average 59.4% |
| Czechoslovakians | 48.3 /100 | #178 | Average 59.4% |
| Bermudans | 46.6 /100 | #179 | Average 59.3% |
| Yugoslavians | 44.1 /100 | #180 | Average 59.2% |
| Swiss | 43.4 /100 | #181 | Average 59.2% |
| Immigrants | Bosnia and Herzegovina | 42.8 /100 | #182 | Average 59.2% |
| German Russians | 39.3 /100 | #183 | Fair 59.1% |
| Spaniards | 38.3 /100 | #184 | Fair 59.0% |
| South Americans | 35.9 /100 | #185 | Fair 59.0% |