Immigrants from England vs Czechoslovakian College, 1 year or more
COMPARE
Immigrants from England
Czechoslovakian
College, 1 year or more
College, 1 year or more Comparison
Immigrants from England
Czechoslovakians
62.8%
COLLEGE, 1 YEAR OR MORE
98.6/ 100
METRIC RATING
84th/ 347
METRIC RANK
59.4%
COLLEGE, 1 YEAR OR MORE
48.3/ 100
METRIC RATING
178th/ 347
METRIC RANK
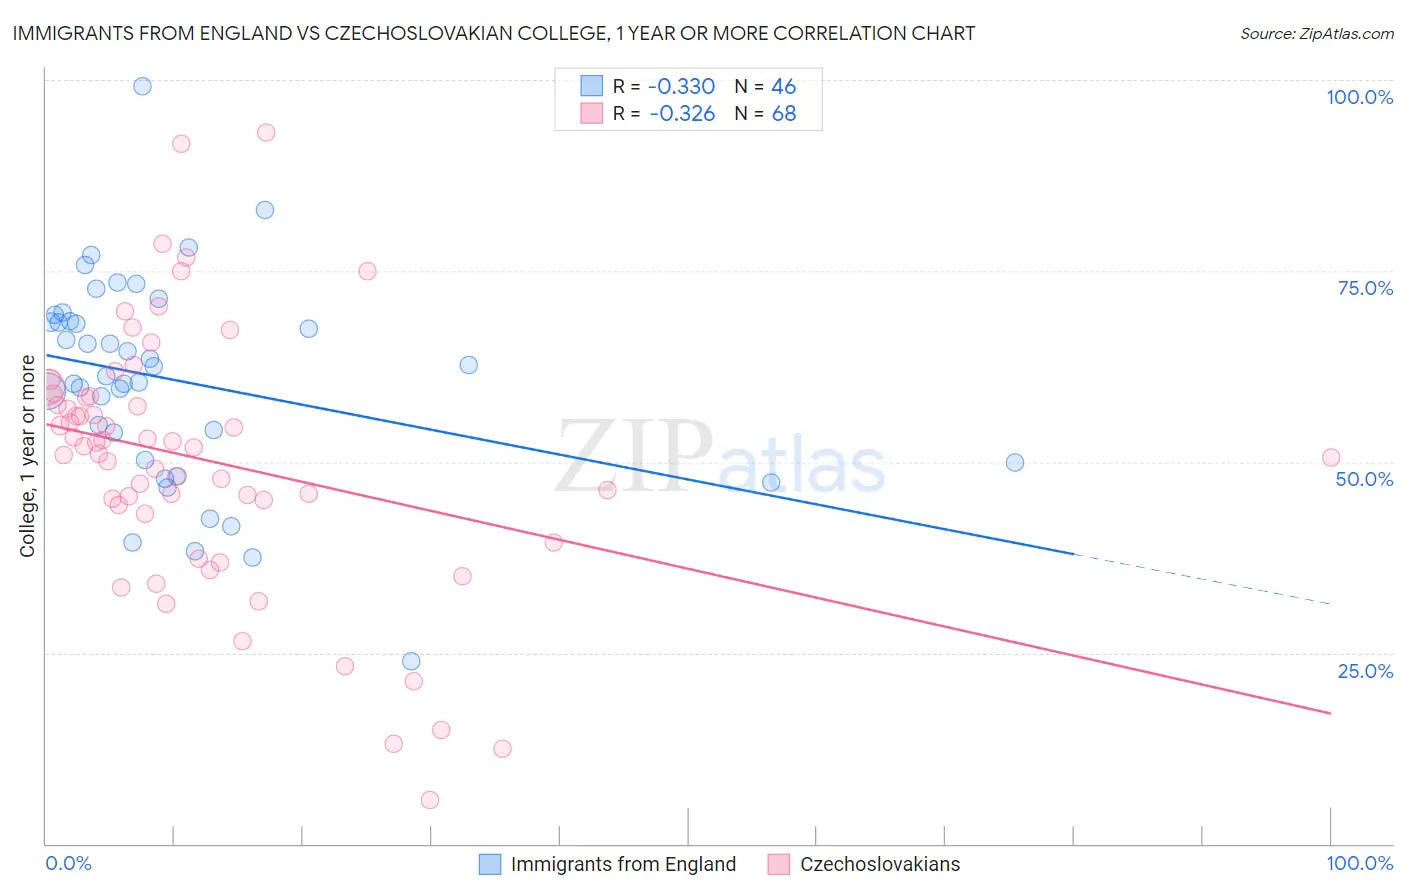
Immigrants from England vs Czechoslovakian College, 1 year or more Correlation Chart
The statistical analysis conducted on geographies consisting of 391,895,815 people shows a mild negative correlation between the proportion of Immigrants from England and percentage of population with at least college, 1 year or more education in the United States with a correlation coefficient (R) of -0.330 and weighted average of 62.8%. Similarly, the statistical analysis conducted on geographies consisting of 368,667,186 people shows a mild negative correlation between the proportion of Czechoslovakians and percentage of population with at least college, 1 year or more education in the United States with a correlation coefficient (R) of -0.326 and weighted average of 59.4%, a difference of 5.7%.
College, 1 year or more Correlation Summary
| Measurement | Immigrants from England | Czechoslovakian |
| Minimum | 23.9% | 5.7% |
| Maximum | 99.1% | 93.1% |
| Range | 75.3% | 87.4% |
| Mean | 60.6% | 50.2% |
| Median | 61.9% | 52.0% |
| Interquartile 25% (IQ1) | 50.3% | 43.7% |
| Interquartile 75% (IQ3) | 68.4% | 58.5% |
| Interquartile Range (IQR) | 18.1% | 14.7% |
| Standard Deviation (Sample) | 13.7% | 17.1% |
| Standard Deviation (Population) | 13.6% | 16.9% |
Similar Demographics by College, 1 year or more
Demographics Similar to Immigrants from England by College, 1 year or more
In terms of college, 1 year or more, the demographic groups most similar to Immigrants from England are Immigrants from Pakistan (62.8%, a difference of 0.010%), Immigrants from Argentina (62.8%, a difference of 0.030%), Immigrants from Western Europe (62.7%, a difference of 0.030%), Immigrants from Hungary (62.7%, a difference of 0.040%), and Immigrants from Bolivia (62.8%, a difference of 0.070%).
| Demographics | Rating | Rank | College, 1 year or more |
| Ethiopians | 98.8 /100 | #77 | Exceptional 62.9% |
| Immigrants | Lebanon | 98.8 /100 | #78 | Exceptional 62.9% |
| Northern Europeans | 98.8 /100 | #79 | Exceptional 62.9% |
| Lithuanians | 98.8 /100 | #80 | Exceptional 62.9% |
| Laotians | 98.7 /100 | #81 | Exceptional 62.8% |
| Immigrants | Bolivia | 98.7 /100 | #82 | Exceptional 62.8% |
| Immigrants | Argentina | 98.6 /100 | #83 | Exceptional 62.8% |
| Immigrants | England | 98.6 /100 | #84 | Exceptional 62.8% |
| Immigrants | Pakistan | 98.6 /100 | #85 | Exceptional 62.8% |
| Immigrants | Western Europe | 98.6 /100 | #86 | Exceptional 62.7% |
| Immigrants | Hungary | 98.6 /100 | #87 | Exceptional 62.7% |
| Greeks | 98.3 /100 | #88 | Exceptional 62.6% |
| Immigrants | Ethiopia | 98.2 /100 | #89 | Exceptional 62.6% |
| Immigrants | Western Asia | 97.9 /100 | #90 | Exceptional 62.5% |
| Immigrants | Eastern Europe | 97.8 /100 | #91 | Exceptional 62.4% |
Demographics Similar to Czechoslovakians by College, 1 year or more
In terms of college, 1 year or more, the demographic groups most similar to Czechoslovakians are Tlingit-Haida (59.4%, a difference of 0.0%), Immigrants from Poland (59.4%, a difference of 0.030%), Sri Lankan (59.4%, a difference of 0.040%), Celtic (59.4%, a difference of 0.090%), and Bermudan (59.3%, a difference of 0.090%).
| Demographics | Rating | Rank | College, 1 year or more |
| Immigrants | Albania | 52.3 /100 | #171 | Average 59.5% |
| Immigrants | Sierra Leone | 52.2 /100 | #172 | Average 59.5% |
| Immigrants | Oceania | 51.2 /100 | #173 | Average 59.4% |
| Celtics | 50.0 /100 | #174 | Average 59.4% |
| Sri Lankans | 49.0 /100 | #175 | Average 59.4% |
| Immigrants | Poland | 48.9 /100 | #176 | Average 59.4% |
| Tlingit-Haida | 48.4 /100 | #177 | Average 59.4% |
| Czechoslovakians | 48.3 /100 | #178 | Average 59.4% |
| Bermudans | 46.6 /100 | #179 | Average 59.3% |
| Yugoslavians | 44.1 /100 | #180 | Average 59.2% |
| Swiss | 43.4 /100 | #181 | Average 59.2% |
| Immigrants | Bosnia and Herzegovina | 42.8 /100 | #182 | Average 59.2% |
| German Russians | 39.3 /100 | #183 | Fair 59.1% |
| Spaniards | 38.3 /100 | #184 | Fair 59.0% |
| South Americans | 35.9 /100 | #185 | Fair 59.0% |