Immigrants from Spain vs Bangladeshi College, 1 year or more
COMPARE
Immigrants from Spain
Bangladeshi
College, 1 year or more
College, 1 year or more Comparison
Immigrants from Spain
Bangladeshis
63.4%
COLLEGE, 1 YEAR OR MORE
99.4/ 100
METRIC RATING
64th/ 347
METRIC RANK
54.5%
COLLEGE, 1 YEAR OR MORE
0.2/ 100
METRIC RATING
269th/ 347
METRIC RANK
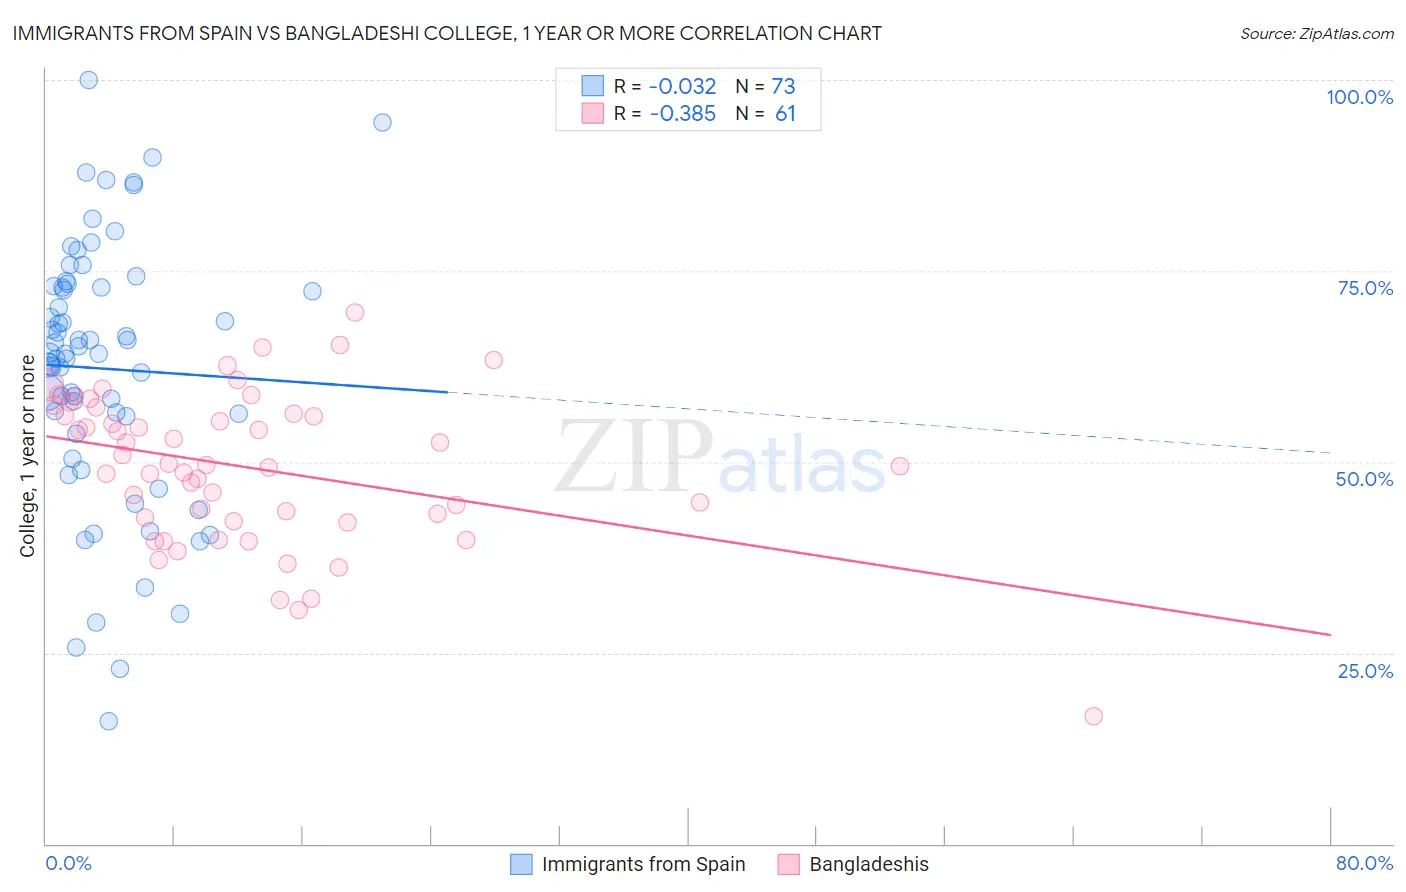
Immigrants from Spain vs Bangladeshi College, 1 year or more Correlation Chart
The statistical analysis conducted on geographies consisting of 239,683,962 people shows no correlation between the proportion of Immigrants from Spain and percentage of population with at least college, 1 year or more education in the United States with a correlation coefficient (R) of -0.032 and weighted average of 63.4%. Similarly, the statistical analysis conducted on geographies consisting of 141,449,898 people shows a mild negative correlation between the proportion of Bangladeshis and percentage of population with at least college, 1 year or more education in the United States with a correlation coefficient (R) of -0.385 and weighted average of 54.5%, a difference of 16.4%.
College, 1 year or more Correlation Summary
| Measurement | Immigrants from Spain | Bangladeshi |
| Minimum | 16.1% | 16.7% |
| Maximum | 100.0% | 69.6% |
| Range | 83.9% | 52.9% |
| Mean | 62.2% | 49.3% |
| Median | 64.1% | 49.6% |
| Interquartile 25% (IQ1) | 54.8% | 42.4% |
| Interquartile 75% (IQ3) | 72.9% | 56.6% |
| Interquartile Range (IQR) | 18.1% | 14.2% |
| Standard Deviation (Sample) | 17.0% | 10.0% |
| Standard Deviation (Population) | 16.9% | 9.9% |
Similar Demographics by College, 1 year or more
Demographics Similar to Immigrants from Spain by College, 1 year or more
In terms of college, 1 year or more, the demographic groups most similar to Immigrants from Spain are Immigrants from Scotland (63.4%, a difference of 0.030%), Maltese (63.4%, a difference of 0.10%), Immigrants from Indonesia (63.5%, a difference of 0.16%), Bolivian (63.5%, a difference of 0.18%), and Immigrants from Europe (63.3%, a difference of 0.21%).
| Demographics | Rating | Rank | College, 1 year or more |
| South Africans | 99.7 /100 | #57 | Exceptional 64.1% |
| Immigrants | Asia | 99.7 /100 | #58 | Exceptional 64.0% |
| Immigrants | Serbia | 99.6 /100 | #59 | Exceptional 63.8% |
| Immigrants | Kazakhstan | 99.5 /100 | #60 | Exceptional 63.6% |
| Bolivians | 99.5 /100 | #61 | Exceptional 63.5% |
| Immigrants | Indonesia | 99.5 /100 | #62 | Exceptional 63.5% |
| Immigrants | Scotland | 99.4 /100 | #63 | Exceptional 63.4% |
| Immigrants | Spain | 99.4 /100 | #64 | Exceptional 63.4% |
| Maltese | 99.3 /100 | #65 | Exceptional 63.4% |
| Immigrants | Europe | 99.3 /100 | #66 | Exceptional 63.3% |
| Immigrants | Romania | 99.3 /100 | #67 | Exceptional 63.3% |
| Immigrants | Greece | 99.3 /100 | #68 | Exceptional 63.3% |
| Immigrants | Zimbabwe | 99.3 /100 | #69 | Exceptional 63.3% |
| Argentineans | 99.2 /100 | #70 | Exceptional 63.2% |
| Immigrants | Canada | 99.1 /100 | #71 | Exceptional 63.1% |
Demographics Similar to Bangladeshis by College, 1 year or more
In terms of college, 1 year or more, the demographic groups most similar to Bangladeshis are British West Indian (54.5%, a difference of 0.030%), Crow (54.5%, a difference of 0.030%), Bahamian (54.5%, a difference of 0.060%), Comanche (54.4%, a difference of 0.10%), and Immigrants from Grenada (54.4%, a difference of 0.14%).
| Demographics | Rating | Rank | College, 1 year or more |
| Immigrants | St. Vincent and the Grenadines | 0.3 /100 | #262 | Tragic 54.8% |
| U.S. Virgin Islanders | 0.3 /100 | #263 | Tragic 54.8% |
| Immigrants | Micronesia | 0.3 /100 | #264 | Tragic 54.8% |
| Immigrants | Laos | 0.2 /100 | #265 | Tragic 54.7% |
| Potawatomi | 0.2 /100 | #266 | Tragic 54.6% |
| Blackfeet | 0.2 /100 | #267 | Tragic 54.6% |
| British West Indians | 0.2 /100 | #268 | Tragic 54.5% |
| Bangladeshis | 0.2 /100 | #269 | Tragic 54.5% |
| Crow | 0.2 /100 | #270 | Tragic 54.5% |
| Bahamians | 0.2 /100 | #271 | Tragic 54.5% |
| Comanche | 0.2 /100 | #272 | Tragic 54.4% |
| Immigrants | Grenada | 0.2 /100 | #273 | Tragic 54.4% |
| Belizeans | 0.2 /100 | #274 | Tragic 54.4% |
| Americans | 0.2 /100 | #275 | Tragic 54.4% |
| Shoshone | 0.2 /100 | #276 | Tragic 54.3% |