Immigrants from Southern Europe vs Immigrants from Malaysia GED/Equivalency

COMPARE

Immigrants from Southern Europe
Race
Ancestry
AfghanAfricanAlaska NativeAlaskan AthabascanAlbanianAleutAlsatianAmericanApacheArabArapahoArgentineanArmenianAssyrian/Chaldean/SyriacAustralianAustrianBahamianBangladeshiBarbadianBasqueBelgianBelizeanBermudanBhutaneseBlackfeetBolivianBrazilianBritishBritish West IndianBulgarianBurmeseCajunCambodianCanadianCape VerdeanCarpatho RusynCelticCentral AmericanCentral American IndianCherokeeCheyenneChickasawChileanChineseChippewaChoctawColombianColvilleComancheCosta RicanCreeCreekCroatianCrowCubanCypriotCzechCzechoslovakianDanishDelawareDominicanDutchDutch West IndianEastern EuropeanEcuadorianEgyptianEnglishEstonianEthiopianEuropeanFijianFilipinoFinnishFrenchFrench American IndianFrench CanadianGermanGerman RussianGhanaianGreekGuamanian/ChamorroGuatemalanGuyaneseHaitianHmongHonduranHopiHoumaHungarianIcelanderIndian (Asian)IndonesianInupiatIranianIraqiIrishIroquoisIsraeliItalianJamaicanJapaneseJordanianKenyanKiowaKoreanLaotianLatvianLebaneseLiberianLithuanianLumbeeLuxembourgerMacedonianMalaysianMalteseMarshalleseMenomineeMexicanMexican American IndianMongolianMoroccanNative HawaiianNavajoNepaleseNew ZealanderNicaraguanNigerianNorthern EuropeanNorwegianOkinawanOsageOttawaPaiutePakistaniPalestinianPanamanianParaguayanPennsylvania GermanPeruvianPimaPolishPortuguesePotawatomiPuebloPuerto RicanPuget Sound SalishRomanianRussianSalvadoranSamoanScandinavianScotch-IrishScottishSeminoleSenegaleseSerbianShoshoneSierra LeoneanSiouxSlavicSlovakSloveneSomaliSouth AfricanSouth AmericanSouth American IndianSoviet UnionSpaniardSpanishSpanish AmericanSpanish American IndianSri LankanSubsaharan AfricanSudaneseSwedishSwissSyrianTaiwaneseThaiTlingit-HaidaTohono O'OdhamTonganTrinidadian and TobagonianTsimshianTurkishU.S. Virgin IslanderUgandanUkrainianUruguayanUteVenezuelanVietnameseWelshWest IndianYakamaYaquiYugoslavianYumanYup'ikZimbabwean
Immigration
NonimmigrantsImmigrantsAfghanistanAfricaAlbaniaArgentinaArmeniaAsiaAustraliaAustriaBahamasBangladeshBarbadosBelarusBelgiumBelizeBoliviaBosnia and HerzegovinaBrazilBulgariaBurma/MyanmarCabo VerdeCambodiaCameroonCanadaCaribbeanCentral AmericaChileChinaColombiaCongoCosta RicaCroatiaCubaCzechoslovakiaDenmarkDominicaDominican RepublicEastern AfricaEastern AsiaEastern EuropeEcuadorEgyptEl SalvadorEnglandEritreaEthiopiaEuropeFijiFranceGermanyGhanaGreeceGrenadaGuatemalaGuyanaHaitiHondurasHong KongHungaryIndiaIndonesiaIranIraqIrelandIsraelItalyJamaicaJapanJordanKazakhstanKenyaKoreaKuwaitLaosLatin AmericaLatviaLebanonLiberiaLithuaniaMexicoMicronesiaMiddle AfricaMoldovaMoroccoNepalNetherlandsNicaraguaNigeriaNorth AmericaNorth MacedoniaNorthern AfricaNorthern EuropeNorwayOceaniaPakistanPanamaPeruPhilippinesPolandPortugalRomaniaRussiaSaudi ArabiaScotlandSenegalSerbiaSierra LeoneSingaporeSomaliaSouth AfricaSouth AmericaSouth Central AsiaSouth Eastern AsiaSouthern EuropeSpainSri LankaSt. Vincent and the GrenadinesSudanSwedenSwitzerlandSyriaTaiwanThailandTrinidad and TobagoTurkeyUgandaUkraineUruguayUzbekistanVenezuelaVietnamWest IndiesWestern AfricaWestern AsiaWestern EuropeYemenZaireZimbabweAzores
Immigrants from Malaysia
Race
Ancestry
AfghanAfricanAlaska NativeAlaskan AthabascanAlbanianAleutAlsatianAmericanApacheArabArapahoArgentineanArmenianAssyrian/Chaldean/SyriacAustralianAustrianBahamianBangladeshiBarbadianBasqueBelgianBelizeanBermudanBhutaneseBlackfeetBolivianBrazilianBritishBritish West IndianBulgarianBurmeseCajunCambodianCanadianCape VerdeanCarpatho RusynCelticCentral AmericanCentral American IndianCherokeeCheyenneChickasawChileanChineseChippewaChoctawColombianColvilleComancheCosta RicanCreeCreekCroatianCrowCubanCypriotCzechCzechoslovakianDanishDelawareDominicanDutchDutch West IndianEastern EuropeanEcuadorianEgyptianEnglishEstonianEthiopianEuropeanFijianFilipinoFinnishFrenchFrench American IndianFrench CanadianGermanGerman RussianGhanaianGreekGuamanian/ChamorroGuatemalanGuyaneseHaitianHmongHonduranHopiHoumaHungarianIcelanderIndian (Asian)IndonesianInupiatIranianIraqiIrishIroquoisIsraeliItalianJamaicanJapaneseJordanianKenyanKiowaKoreanLaotianLatvianLebaneseLiberianLithuanianLumbeeLuxembourgerMacedonianMalaysianMalteseMarshalleseMenomineeMexicanMexican American IndianMongolianMoroccanNative HawaiianNavajoNepaleseNew ZealanderNicaraguanNigerianNorthern EuropeanNorwegianOkinawanOsageOttawaPaiutePakistaniPalestinianPanamanianParaguayanPennsylvania GermanPeruvianPimaPolishPortuguesePotawatomiPuebloPuerto RicanPuget Sound SalishRomanianRussianSalvadoranSamoanScandinavianScotch-IrishScottishSeminoleSenegaleseSerbianShoshoneSierra LeoneanSiouxSlavicSlovakSloveneSomaliSouth AfricanSouth AmericanSouth American IndianSoviet UnionSpaniardSpanishSpanish AmericanSpanish American IndianSri LankanSubsaharan AfricanSudaneseSwedishSwissSyrianTaiwaneseThaiTlingit-HaidaTohono O'OdhamTonganTrinidadian and TobagonianTsimshianTurkishU.S. Virgin IslanderUgandanUkrainianUruguayanUteVenezuelanVietnameseWelshWest IndianYakamaYaquiYugoslavianYumanYup'ikZimbabwean
Immigration
NonimmigrantsImmigrantsAfghanistanAfricaAlbaniaArgentinaArmeniaAsiaAustraliaAustriaBahamasBangladeshBarbadosBelarusBelgiumBelizeBoliviaBosnia and HerzegovinaBrazilBulgariaBurma/MyanmarCabo VerdeCambodiaCameroonCanadaCaribbeanCentral AmericaChileChinaColombiaCongoCosta RicaCroatiaCubaCzechoslovakiaDenmarkDominicaDominican RepublicEastern AfricaEastern AsiaEastern EuropeEcuadorEgyptEl SalvadorEnglandEritreaEthiopiaEuropeFijiFranceGermanyGhanaGreeceGrenadaGuatemalaGuyanaHaitiHondurasHong KongHungaryIndiaIndonesiaIranIraqIrelandIsraelItalyJamaicaJapanJordanKazakhstanKenyaKoreaKuwaitLaosLatin AmericaLatviaLebanonLiberiaLithuaniaMalaysiaMexicoMicronesiaMiddle AfricaMoldovaMoroccoNepalNetherlandsNicaraguaNigeriaNorth AmericaNorth MacedoniaNorthern AfricaNorthern EuropeNorwayOceaniaPakistanPanamaPeruPhilippinesPolandPortugalRomaniaRussiaSaudi ArabiaScotlandSenegalSerbiaSierra LeoneSingaporeSomaliaSouth AfricaSouth AmericaSouth Central AsiaSouth Eastern AsiaSpainSri LankaSt. Vincent and the GrenadinesSudanSwedenSwitzerlandSyriaTaiwanThailandTrinidad and TobagoTurkeyUgandaUkraineUruguayUzbekistanVenezuelaVietnamWest IndiesWestern AfricaWestern AsiaWestern EuropeYemenZaireZimbabweAzores
GED/Equivalency
Income
Poverty
Unemployment
Labor Participation
Family Structure
Vehicle Availability
Education Level
Disability

GED/Equivalency Comparison

Immigrants from Southern Europe

Immigrants from Malaysia

Fair
Excellent
85.5%
GED/EQUIVALENCY
38.4/ 100
METRIC RATING
180th/ 347
METRIC RANK
86.5%
GED/EQUIVALENCY
85.0/ 100
METRIC RATING
139th/ 347
METRIC RANK

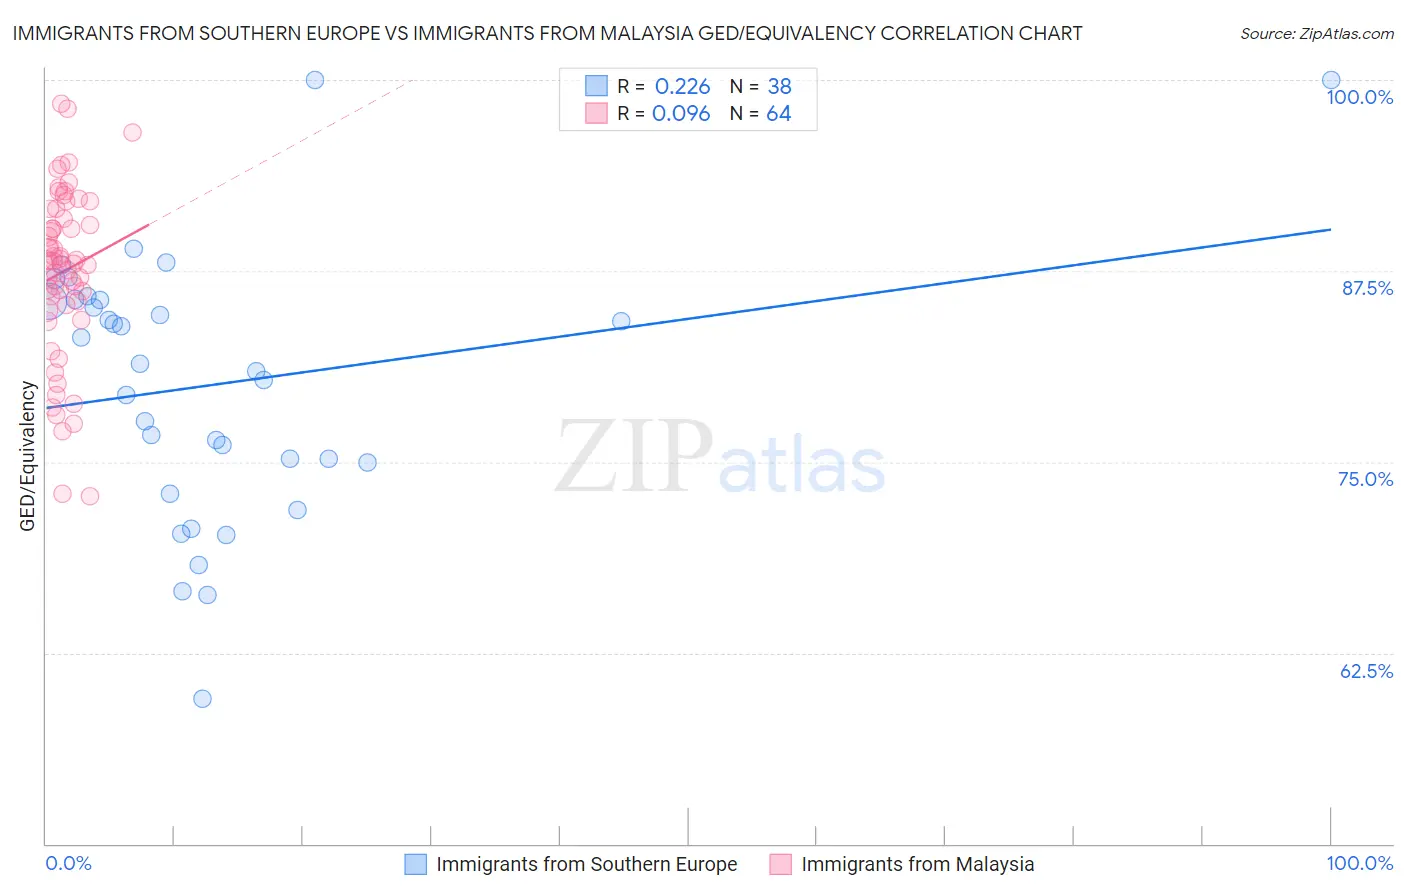
Immigrants from Southern Europe vs Immigrants from Malaysia GED/Equivalency Correlation Chart

The statistical analysis conducted on geographies consisting of 402,804,595 people shows a weak positive correlation between the proportion of Immigrants from Southern Europe and percentage of population with at least ged/equivalency education in the United States with a correlation coefficient (R) of 0.226 and weighted average of 85.5%. Similarly, the statistical analysis conducted on geographies consisting of 197,973,854 people shows a slight positive correlation between the proportion of Immigrants from Malaysia and percentage of population with at least ged/equivalency education in the United States with a correlation coefficient (R) of 0.096 and weighted average of 86.5%, a difference of 1.1%.
Immigrants from Southern Europe vs Immigrants from Malaysia GED/Equivalency

GED/Equivalency Correlation Summary

MeasurementImmigrants from Southern EuropeImmigrants from Malaysia
Minimum59.5%72.7%
Maximum100.0%98.4%
Range40.5%25.7%
Mean80.0%87.5%
Median81.2%88.1%
Interquartile 25% (IQ1)75.0%85.4%
Interquartile 75% (IQ3)85.6%91.2%
Interquartile Range (IQR)10.6%5.8%
Standard Deviation (Sample)8.7%5.5%
Standard Deviation (Population)8.6%5.5%

Similar Demographics by GED/Equivalency

Demographics Similar to Immigrants from Southern Europe by GED/Equivalency

In terms of ged/equivalency, the demographic groups most similar to Immigrants from Southern Europe are Moroccan (85.5%, a difference of 0.020%), Aleut (85.6%, a difference of 0.040%), Korean (85.6%, a difference of 0.060%), Sudanese (85.5%, a difference of 0.070%), and Immigrants from Sudan (85.5%, a difference of 0.090%).
DemographicsRating | RankGED/Equivalency
Immigrants | Venezuela
50.7
/100
|
#173
Average
85.8%
Ottawa
50.0
/100
|
#174
Average
85.8%
Immigrants | Bolivia
49.8
/100
|
#175
Average
85.8%
Immigrants | Eastern Africa
47.7
/100
|
#176
Average
85.7%
Immigrants | Uganda
45.2
/100
|
#177
Average
85.7%
Koreans
41.2
/100
|
#178
Average
85.6%
Aleuts
40.5
/100
|
#179
Average
85.6%
Immigrants | Southern Europe
38.4
/100
|
#180
Fair
85.5%
Moroccans
37.7
/100
|
#181
Fair
85.5%
Sudanese
35.2
/100
|
#182
Fair
85.5%
Immigrants | Sudan
34.2
/100
|
#183
Fair
85.5%
Immigrants | Oceania
33.6
/100
|
#184
Fair
85.5%
Spanish
32.8
/100
|
#185
Fair
85.4%
Spaniards
31.9
/100
|
#186
Fair
85.4%
Immigrants | Afghanistan
29.8
/100
|
#187
Fair
85.4%

Demographics Similar to Immigrants from Malaysia by GED/Equivalency

In terms of ged/equivalency, the demographic groups most similar to Immigrants from Malaysia are Paraguayan (86.5%, a difference of 0.030%), Immigrants from Argentina (86.6%, a difference of 0.060%), Arab (86.6%, a difference of 0.070%), Laotian (86.5%, a difference of 0.070%), and Chilean (86.6%, a difference of 0.080%).
DemographicsRating | RankGED/Equivalency
Immigrants | Brazil
88.4
/100
|
#132
Excellent
86.6%
Tsimshian
88.3
/100
|
#133
Excellent
86.6%
Albanians
87.7
/100
|
#134
Excellent
86.6%
Immigrants | Asia
87.4
/100
|
#135
Excellent
86.6%
Chileans
86.9
/100
|
#136
Excellent
86.6%
Arabs
86.7
/100
|
#137
Excellent
86.6%
Immigrants | Argentina
86.5
/100
|
#138
Excellent
86.6%
Immigrants | Malaysia
85.0
/100
|
#139
Excellent
86.5%
Paraguayans
84.1
/100
|
#140
Excellent
86.5%
Laotians
83.2
/100
|
#141
Excellent
86.5%
Immigrants | Indonesia
82.4
/100
|
#142
Excellent
86.4%
Immigrants | Pakistan
82.4
/100
|
#143
Excellent
86.4%
Bolivians
82.1
/100
|
#144
Excellent
86.4%
Pakistanis
80.4
/100
|
#145
Excellent
86.4%
Basques
79.5
/100
|
#146
Good
86.4%