Immigrants from Southern Europe vs Immigrants from Malaysia Householder Income Under 25 years
COMPARE
Immigrants from Southern Europe
Immigrants from Malaysia
Householder Income Under 25 years
Householder Income Under 25 years Comparison
Immigrants from Southern Europe
Immigrants from Malaysia
$54,484
HOUSEHOLDER INCOME UNDER 25 YEARS
99.6/ 100
METRIC RATING
77th/ 347
METRIC RANK
$54,179
HOUSEHOLDER INCOME UNDER 25 YEARS
99.2/ 100
METRIC RATING
95th/ 347
METRIC RANK
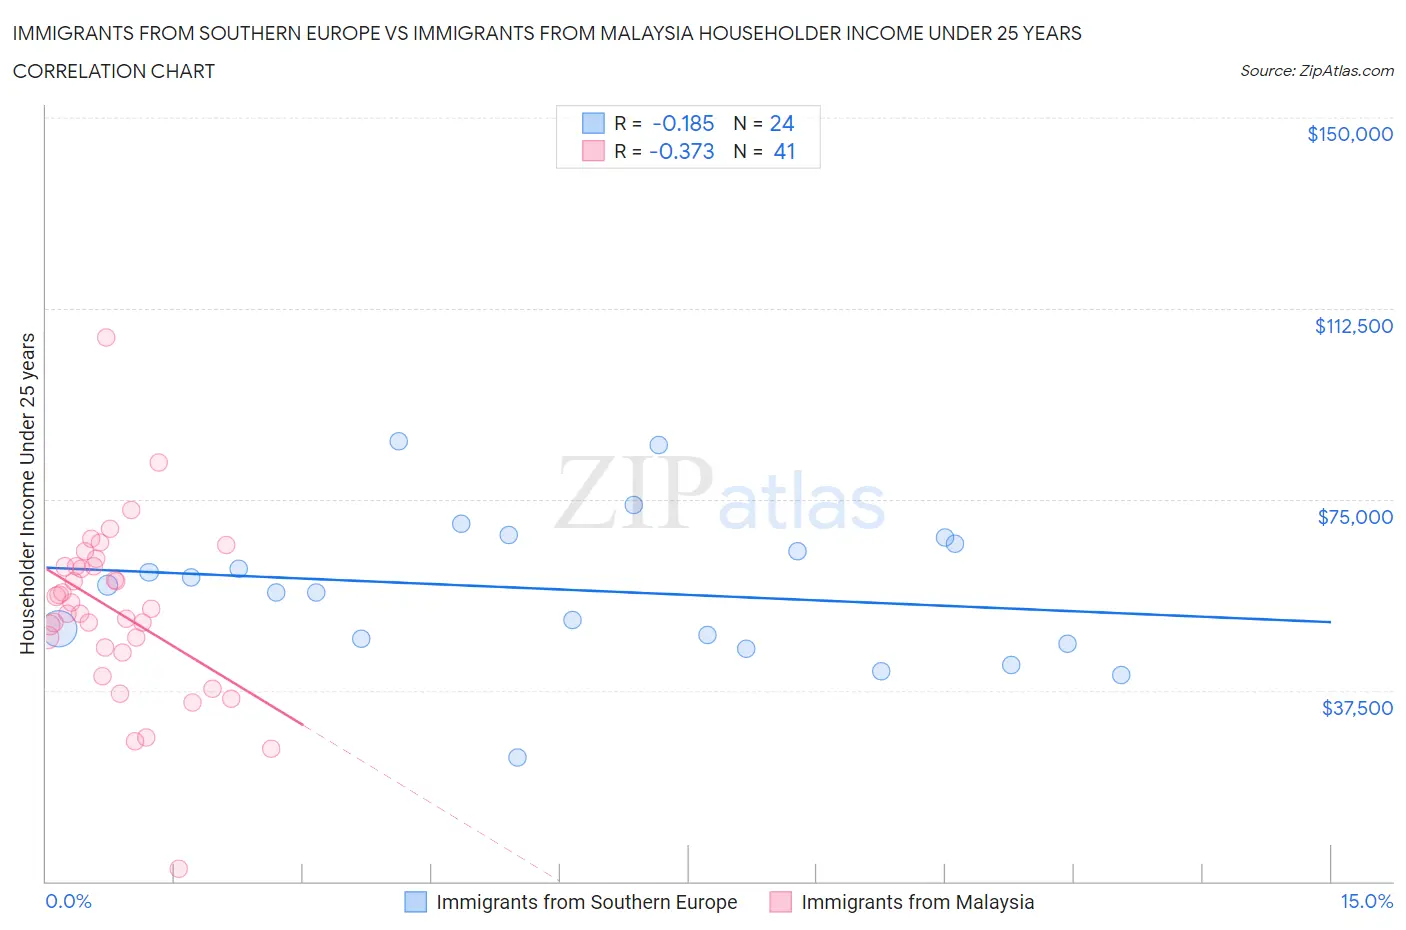
Immigrants from Southern Europe vs Immigrants from Malaysia Householder Income Under 25 years Correlation Chart
The statistical analysis conducted on geographies consisting of 332,779,485 people shows a poor negative correlation between the proportion of Immigrants from Southern Europe and household income with householder under the age of 25 in the United States with a correlation coefficient (R) of -0.185 and weighted average of $54,484. Similarly, the statistical analysis conducted on geographies consisting of 176,157,143 people shows a mild negative correlation between the proportion of Immigrants from Malaysia and household income with householder under the age of 25 in the United States with a correlation coefficient (R) of -0.373 and weighted average of $54,179, a difference of 0.56%.
Householder Income Under 25 years Correlation Summary
| Measurement | Immigrants from Southern Europe | Immigrants from Malaysia |
| Minimum | $24,293 | $2,499 |
| Maximum | $86,315 | $106,721 |
| Range | $62,022 | $104,222 |
| Mean | $57,230 | $53,085 |
| Median | $57,501 | $53,409 |
| Interquartile 25% (IQ1) | $47,158 | $45,363 |
| Interquartile 75% (IQ3) | $66,842 | $61,933 |
| Interquartile Range (IQR) | $19,684 | $16,570 |
| Standard Deviation (Sample) | $14,522 | $17,081 |
| Standard Deviation (Population) | $14,216 | $16,871 |
Demographics Similar to Immigrants from Southern Europe and Immigrants from Malaysia by Householder Income Under 25 years
In terms of householder income under 25 years, the demographic groups most similar to Immigrants from Southern Europe are Immigrants from Brazil ($54,487, a difference of 0.010%), Nepalese ($54,472, a difference of 0.020%), Immigrants from Italy ($54,449, a difference of 0.060%), Egyptian ($54,444, a difference of 0.070%), and Portuguese ($54,436, a difference of 0.090%). Similarly, the demographic groups most similar to Immigrants from Malaysia are Immigrants from Sierra Leone ($54,190, a difference of 0.020%), Immigrants from Argentina ($54,209, a difference of 0.050%), Argentinean ($54,154, a difference of 0.050%), Immigrants from St. Vincent and the Grenadines ($54,230, a difference of 0.090%), and Immigrants from Egypt ($54,239, a difference of 0.11%).
| Demographics | Rating | Rank | Householder Income Under 25 years |
| Immigrants | Brazil | 99.6 /100 | #76 | Exceptional $54,487 |
| Immigrants | Southern Europe | 99.6 /100 | #77 | Exceptional $54,484 |
| Nepalese | 99.6 /100 | #78 | Exceptional $54,472 |
| Immigrants | Italy | 99.6 /100 | #79 | Exceptional $54,449 |
| Egyptians | 99.6 /100 | #80 | Exceptional $54,444 |
| Portuguese | 99.6 /100 | #81 | Exceptional $54,436 |
| Russians | 99.5 /100 | #82 | Exceptional $54,389 |
| Laotians | 99.5 /100 | #83 | Exceptional $54,369 |
| Bulgarians | 99.5 /100 | #84 | Exceptional $54,352 |
| Immigrants | Czechoslovakia | 99.5 /100 | #85 | Exceptional $54,352 |
| Immigrants | Croatia | 99.5 /100 | #86 | Exceptional $54,343 |
| Brazilians | 99.5 /100 | #87 | Exceptional $54,335 |
| Yakama | 99.5 /100 | #88 | Exceptional $54,321 |
| Immigrants | South America | 99.4 /100 | #89 | Exceptional $54,268 |
| Turks | 99.4 /100 | #90 | Exceptional $54,266 |
| Immigrants | Egypt | 99.3 /100 | #91 | Exceptional $54,239 |
| Immigrants | St. Vincent and the Grenadines | 99.3 /100 | #92 | Exceptional $54,230 |
| Immigrants | Argentina | 99.3 /100 | #93 | Exceptional $54,209 |
| Immigrants | Sierra Leone | 99.3 /100 | #94 | Exceptional $54,190 |
| Immigrants | Malaysia | 99.2 /100 | #95 | Exceptional $54,179 |
| Argentineans | 99.2 /100 | #96 | Exceptional $54,154 |