Immigrants from Middle Africa vs Menominee Bachelor's Degree
COMPARE
Immigrants from Middle Africa
Menominee
Bachelor's Degree
Bachelor's Degree Comparison
Immigrants from Middle Africa
Menominee
36.6%
BACHELOR'S DEGREE
20.6/ 100
METRIC RATING
207th/ 347
METRIC RANK
27.3%
BACHELOR'S DEGREE
0.0/ 100
METRIC RATING
332nd/ 347
METRIC RANK
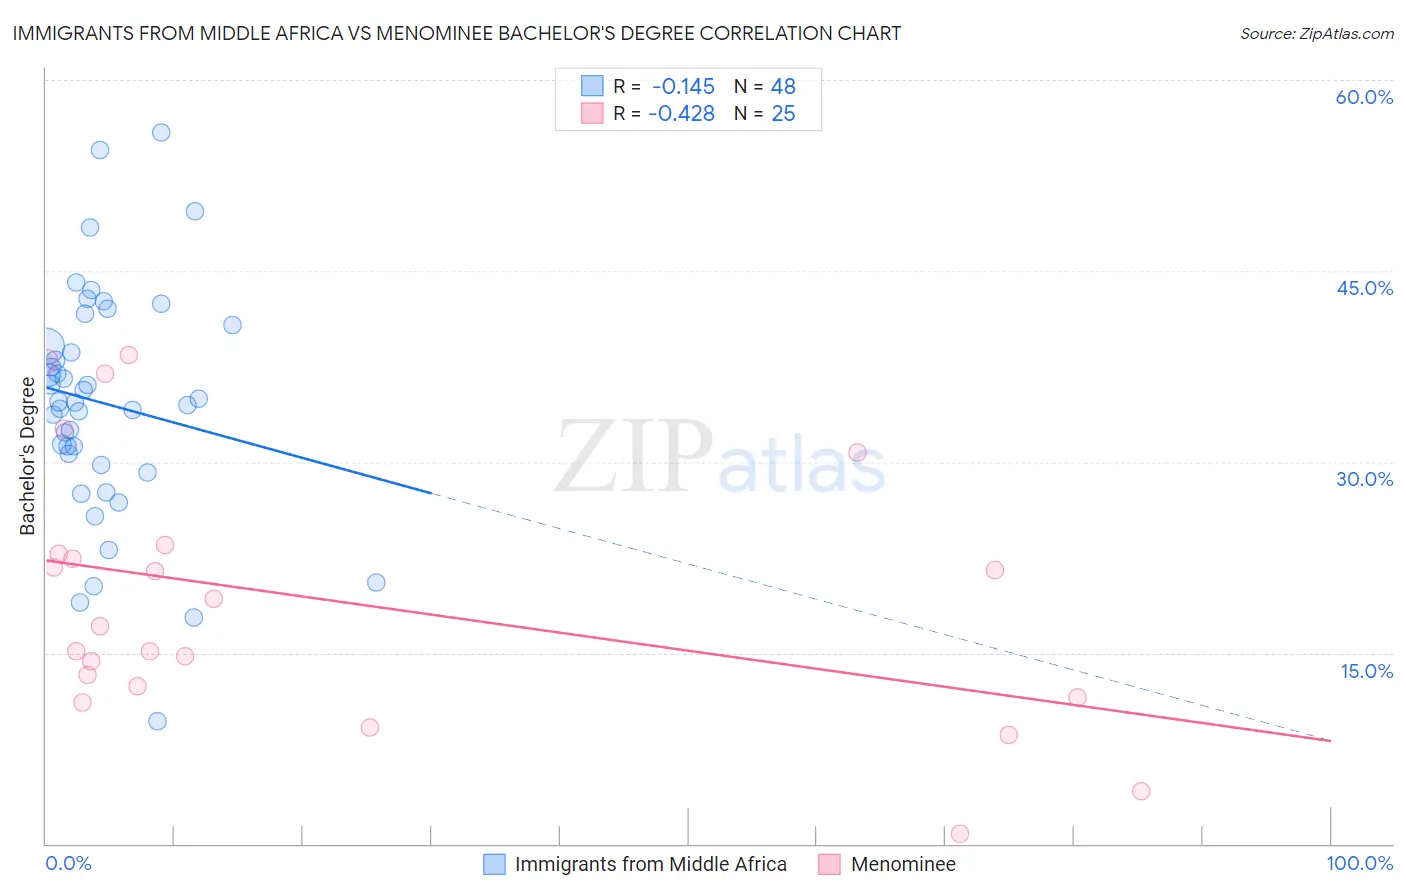
Immigrants from Middle Africa vs Menominee Bachelor's Degree Correlation Chart
The statistical analysis conducted on geographies consisting of 202,742,104 people shows a poor negative correlation between the proportion of Immigrants from Middle Africa and percentage of population with at least bachelor's degree education in the United States with a correlation coefficient (R) of -0.145 and weighted average of 36.6%. Similarly, the statistical analysis conducted on geographies consisting of 45,778,829 people shows a moderate negative correlation between the proportion of Menominee and percentage of population with at least bachelor's degree education in the United States with a correlation coefficient (R) of -0.428 and weighted average of 27.3%, a difference of 34.0%.
Bachelor's Degree Correlation Summary
| Measurement | Immigrants from Middle Africa | Menominee |
| Minimum | 9.6% | 0.82% |
| Maximum | 55.9% | 38.4% |
| Range | 46.3% | 37.6% |
| Mean | 34.6% | 19.1% |
| Median | 34.7% | 17.1% |
| Interquartile 25% (IQ1) | 30.2% | 12.0% |
| Interquartile 75% (IQ3) | 39.9% | 23.1% |
| Interquartile Range (IQR) | 9.7% | 11.2% |
| Standard Deviation (Sample) | 9.1% | 10.1% |
| Standard Deviation (Population) | 9.0% | 9.9% |
Similar Demographics by Bachelor's Degree
Demographics Similar to Immigrants from Middle Africa by Bachelor's Degree
In terms of bachelor's degree, the demographic groups most similar to Immigrants from Middle Africa are Spaniard (36.6%, a difference of 0.090%), Immigrants from Thailand (36.5%, a difference of 0.19%), Finnish (36.7%, a difference of 0.23%), Panamanian (36.5%, a difference of 0.30%), and French (36.5%, a difference of 0.32%).
| Demographics | Rating | Rank | Bachelor's Degree |
| Immigrants | Ghana | 27.4 /100 | #200 | Fair 36.9% |
| Immigrants | South Eastern Asia | 25.4 /100 | #201 | Fair 36.8% |
| Immigrants | Zaire | 25.3 /100 | #202 | Fair 36.8% |
| Immigrants | Nigeria | 23.1 /100 | #203 | Fair 36.7% |
| Immigrants | Immigrants | 22.8 /100 | #204 | Fair 36.7% |
| Finns | 22.2 /100 | #205 | Fair 36.7% |
| Spaniards | 21.2 /100 | #206 | Fair 36.6% |
| Immigrants | Middle Africa | 20.6 /100 | #207 | Fair 36.6% |
| Immigrants | Thailand | 19.4 /100 | #208 | Poor 36.5% |
| Panamanians | 18.8 /100 | #209 | Poor 36.5% |
| French | 18.6 /100 | #210 | Poor 36.5% |
| Scotch-Irish | 18.3 /100 | #211 | Poor 36.4% |
| Immigrants | Philippines | 17.8 /100 | #212 | Poor 36.4% |
| Immigrants | Panama | 14.2 /100 | #213 | Poor 36.2% |
| Germans | 13.9 /100 | #214 | Poor 36.1% |
Demographics Similar to Menominee by Bachelor's Degree
In terms of bachelor's degree, the demographic groups most similar to Menominee are Immigrants from the Azores (27.3%, a difference of 0.10%), Spanish American Indian (27.5%, a difference of 0.58%), Immigrants from Central America (27.5%, a difference of 0.64%), Mexican (27.1%, a difference of 0.82%), and Crow (27.7%, a difference of 1.7%).
| Demographics | Rating | Rank | Bachelor's Degree |
| Pennsylvania Germans | 0.0 /100 | #325 | Tragic 28.4% |
| Apache | 0.0 /100 | #326 | Tragic 28.3% |
| Paiute | 0.0 /100 | #327 | Tragic 28.1% |
| Crow | 0.0 /100 | #328 | Tragic 27.7% |
| Immigrants | Central America | 0.0 /100 | #329 | Tragic 27.5% |
| Spanish American Indians | 0.0 /100 | #330 | Tragic 27.5% |
| Immigrants | Azores | 0.0 /100 | #331 | Tragic 27.3% |
| Menominee | 0.0 /100 | #332 | Tragic 27.3% |
| Mexicans | 0.0 /100 | #333 | Tragic 27.1% |
| Arapaho | 0.0 /100 | #334 | Tragic 26.6% |
| Natives/Alaskans | 0.0 /100 | #335 | Tragic 26.3% |
| Immigrants | Mexico | 0.0 /100 | #336 | Tragic 26.1% |
| Inupiat | 0.0 /100 | #337 | Tragic 25.8% |
| Pueblo | 0.0 /100 | #338 | Tragic 25.5% |
| Hopi | 0.0 /100 | #339 | Tragic 25.3% |