Immigrants from Middle Africa vs Mexican American Indian Bachelor's Degree
COMPARE
Immigrants from Middle Africa
Mexican American Indian
Bachelor's Degree
Bachelor's Degree Comparison
Immigrants from Middle Africa
Mexican American Indians
36.6%
BACHELOR'S DEGREE
20.6/ 100
METRIC RATING
207th/ 347
METRIC RANK
30.2%
BACHELOR'S DEGREE
0.0/ 100
METRIC RATING
302nd/ 347
METRIC RANK
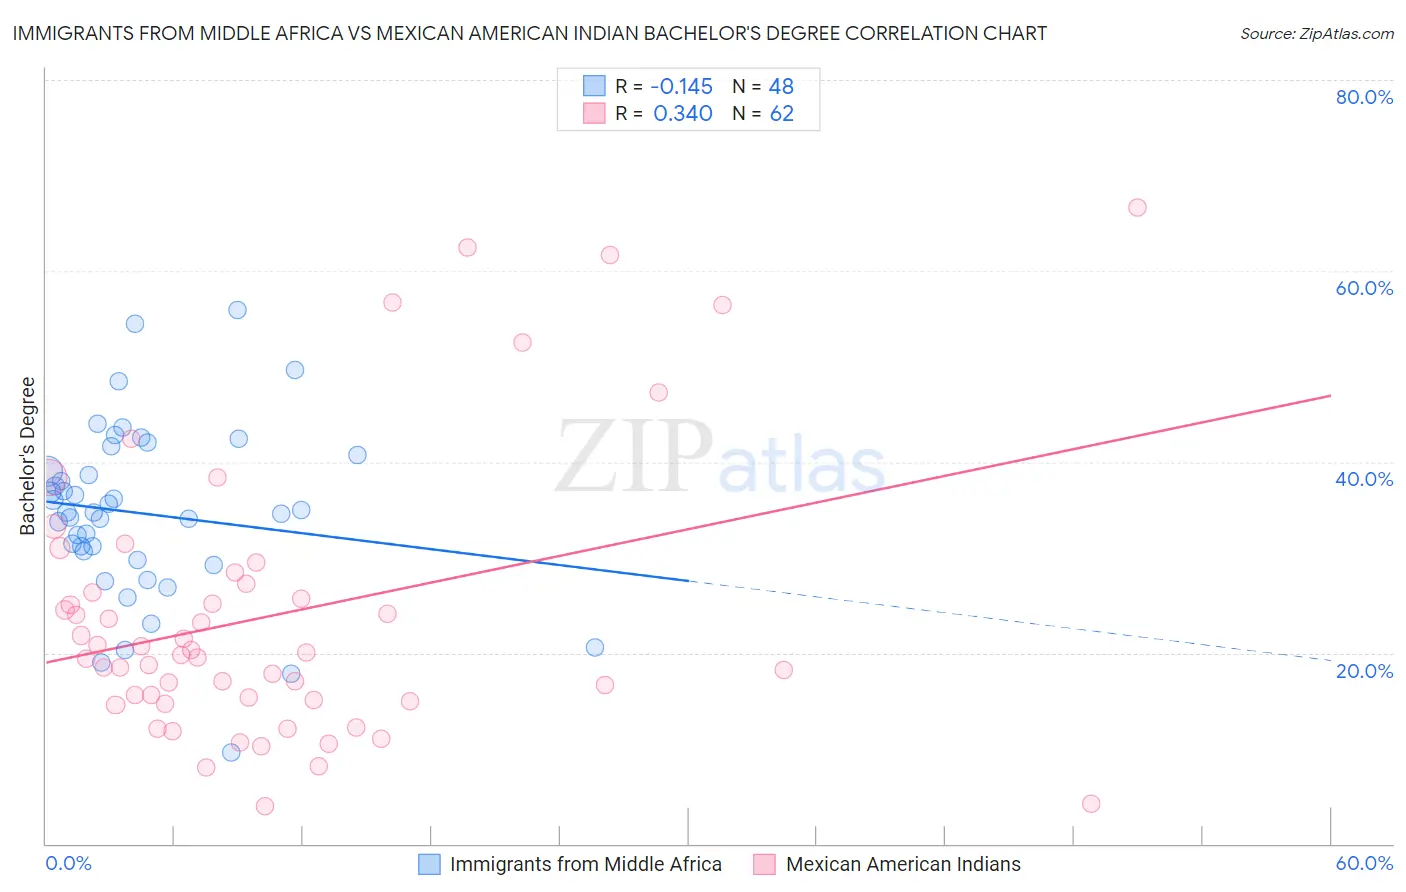
Immigrants from Middle Africa vs Mexican American Indian Bachelor's Degree Correlation Chart
The statistical analysis conducted on geographies consisting of 202,742,104 people shows a poor negative correlation between the proportion of Immigrants from Middle Africa and percentage of population with at least bachelor's degree education in the United States with a correlation coefficient (R) of -0.145 and weighted average of 36.6%. Similarly, the statistical analysis conducted on geographies consisting of 317,609,381 people shows a mild positive correlation between the proportion of Mexican American Indians and percentage of population with at least bachelor's degree education in the United States with a correlation coefficient (R) of 0.340 and weighted average of 30.2%, a difference of 21.0%.
Bachelor's Degree Correlation Summary
| Measurement | Immigrants from Middle Africa | Mexican American Indian |
| Minimum | 9.6% | 3.9% |
| Maximum | 55.9% | 66.7% |
| Range | 46.3% | 62.8% |
| Mean | 34.6% | 24.0% |
| Median | 34.7% | 19.9% |
| Interquartile 25% (IQ1) | 30.2% | 15.0% |
| Interquartile 75% (IQ3) | 39.9% | 27.2% |
| Interquartile Range (IQR) | 9.7% | 12.2% |
| Standard Deviation (Sample) | 9.1% | 14.5% |
| Standard Deviation (Population) | 9.0% | 14.4% |
Similar Demographics by Bachelor's Degree
Demographics Similar to Immigrants from Middle Africa by Bachelor's Degree
In terms of bachelor's degree, the demographic groups most similar to Immigrants from Middle Africa are Spaniard (36.6%, a difference of 0.090%), Immigrants from Thailand (36.5%, a difference of 0.19%), Finnish (36.7%, a difference of 0.23%), Panamanian (36.5%, a difference of 0.30%), and French (36.5%, a difference of 0.32%).
| Demographics | Rating | Rank | Bachelor's Degree |
| Immigrants | Ghana | 27.4 /100 | #200 | Fair 36.9% |
| Immigrants | South Eastern Asia | 25.4 /100 | #201 | Fair 36.8% |
| Immigrants | Zaire | 25.3 /100 | #202 | Fair 36.8% |
| Immigrants | Nigeria | 23.1 /100 | #203 | Fair 36.7% |
| Immigrants | Immigrants | 22.8 /100 | #204 | Fair 36.7% |
| Finns | 22.2 /100 | #205 | Fair 36.7% |
| Spaniards | 21.2 /100 | #206 | Fair 36.6% |
| Immigrants | Middle Africa | 20.6 /100 | #207 | Fair 36.6% |
| Immigrants | Thailand | 19.4 /100 | #208 | Poor 36.5% |
| Panamanians | 18.8 /100 | #209 | Poor 36.5% |
| French | 18.6 /100 | #210 | Poor 36.5% |
| Scotch-Irish | 18.3 /100 | #211 | Poor 36.4% |
| Immigrants | Philippines | 17.8 /100 | #212 | Poor 36.4% |
| Immigrants | Panama | 14.2 /100 | #213 | Poor 36.2% |
| Germans | 13.9 /100 | #214 | Poor 36.1% |
Demographics Similar to Mexican American Indians by Bachelor's Degree
In terms of bachelor's degree, the demographic groups most similar to Mexican American Indians are Bangladeshi (30.2%, a difference of 0.17%), Cherokee (30.2%, a difference of 0.17%), Immigrants from Cuba (30.3%, a difference of 0.28%), Immigrants from Micronesia (30.4%, a difference of 0.49%), and Chickasaw (30.4%, a difference of 0.51%).
| Demographics | Rating | Rank | Bachelor's Degree |
| Immigrants | Dominican Republic | 0.0 /100 | #295 | Tragic 30.7% |
| Puget Sound Salish | 0.0 /100 | #296 | Tragic 30.7% |
| Immigrants | Haiti | 0.0 /100 | #297 | Tragic 30.6% |
| Chippewa | 0.0 /100 | #298 | Tragic 30.6% |
| Chickasaw | 0.0 /100 | #299 | Tragic 30.4% |
| Immigrants | Micronesia | 0.0 /100 | #300 | Tragic 30.4% |
| Immigrants | Cuba | 0.0 /100 | #301 | Tragic 30.3% |
| Mexican American Indians | 0.0 /100 | #302 | Tragic 30.2% |
| Bangladeshis | 0.0 /100 | #303 | Tragic 30.2% |
| Cherokee | 0.0 /100 | #304 | Tragic 30.2% |
| Immigrants | Latin America | 0.0 /100 | #305 | Tragic 30.1% |
| Immigrants | Yemen | 0.0 /100 | #306 | Tragic 29.9% |
| Nepalese | 0.0 /100 | #307 | Tragic 29.9% |
| Cajuns | 0.0 /100 | #308 | Tragic 29.6% |
| Hispanics or Latinos | 0.0 /100 | #309 | Tragic 29.6% |