Crow vs Menominee Bachelor's Degree
COMPARE
Crow
Menominee
Bachelor's Degree
Bachelor's Degree Comparison
Crow
Menominee
27.7%
BACHELOR'S DEGREE
0.0/ 100
METRIC RATING
328th/ 347
METRIC RANK
27.3%
BACHELOR'S DEGREE
0.0/ 100
METRIC RATING
332nd/ 347
METRIC RANK
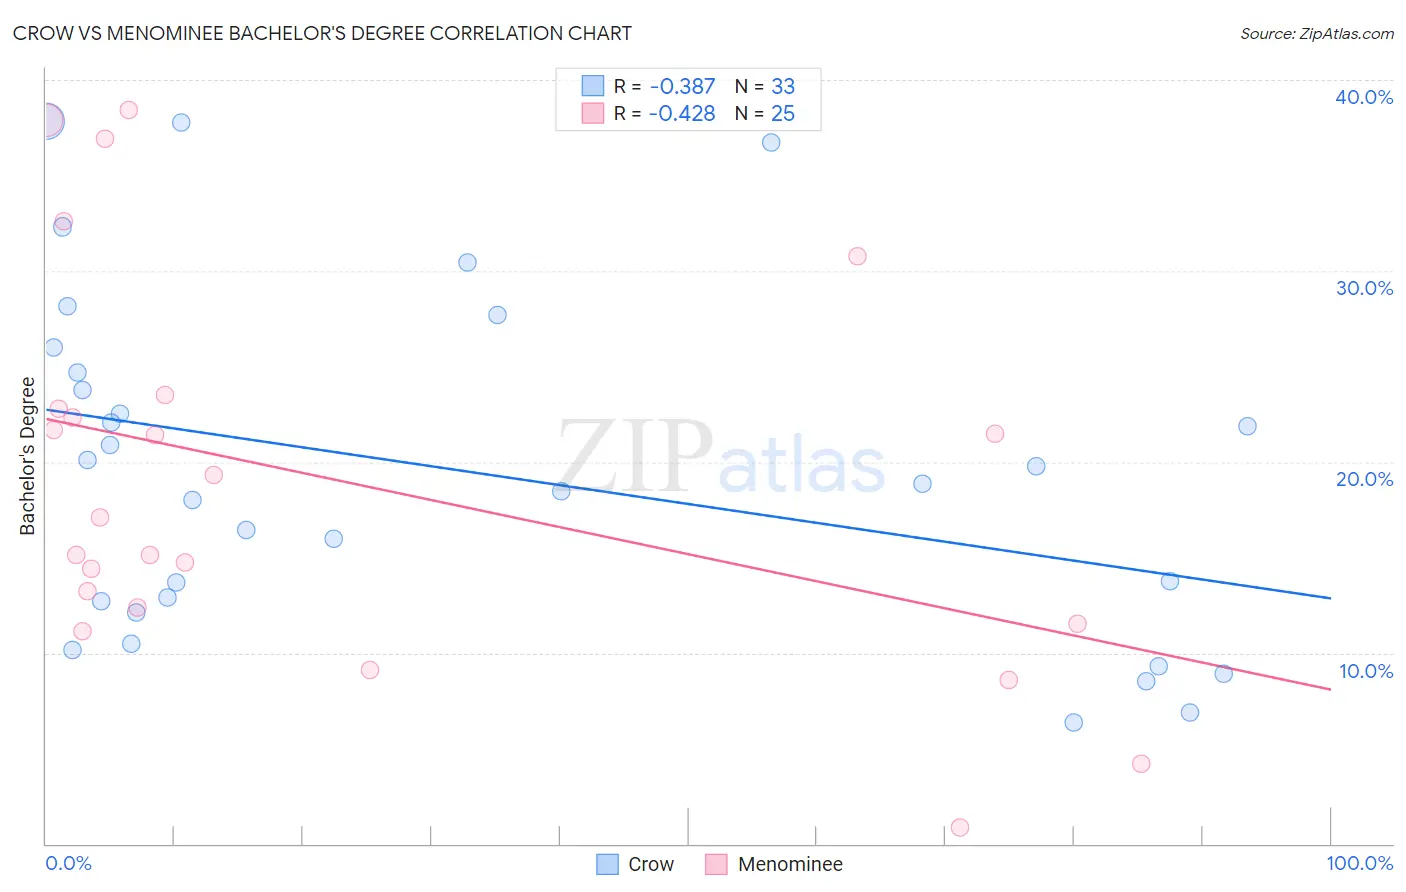
Crow vs Menominee Bachelor's Degree Correlation Chart
The statistical analysis conducted on geographies consisting of 59,206,788 people shows a mild negative correlation between the proportion of Crow and percentage of population with at least bachelor's degree education in the United States with a correlation coefficient (R) of -0.387 and weighted average of 27.7%. Similarly, the statistical analysis conducted on geographies consisting of 45,778,829 people shows a moderate negative correlation between the proportion of Menominee and percentage of population with at least bachelor's degree education in the United States with a correlation coefficient (R) of -0.428 and weighted average of 27.3%, a difference of 1.7%.
Bachelor's Degree Correlation Summary
| Measurement | Crow | Menominee |
| Minimum | 6.4% | 0.82% |
| Maximum | 37.8% | 38.4% |
| Range | 31.4% | 37.6% |
| Mean | 19.6% | 19.1% |
| Median | 18.8% | 17.1% |
| Interquartile 25% (IQ1) | 12.4% | 12.0% |
| Interquartile 75% (IQ3) | 25.3% | 23.1% |
| Interquartile Range (IQR) | 12.9% | 11.2% |
| Standard Deviation (Sample) | 9.0% | 10.1% |
| Standard Deviation (Population) | 8.8% | 9.9% |
Demographics Similar to Crow and Menominee by Bachelor's Degree
In terms of bachelor's degree, the demographic groups most similar to Crow are Immigrants from Central America (27.5%, a difference of 1.0%), Spanish American Indian (27.5%, a difference of 1.1%), Paiute (28.1%, a difference of 1.2%), Immigrants from the Azores (27.3%, a difference of 1.5%), and Apache (28.3%, a difference of 1.9%). Similarly, the demographic groups most similar to Menominee are Immigrants from the Azores (27.3%, a difference of 0.10%), Spanish American Indian (27.5%, a difference of 0.58%), Immigrants from Central America (27.5%, a difference of 0.64%), Mexican (27.1%, a difference of 0.82%), and Arapaho (26.6%, a difference of 2.5%).
| Demographics | Rating | Rank | Bachelor's Degree |
| Kiowa | 0.0 /100 | #320 | Tragic 28.8% |
| Alaskan Athabascans | 0.0 /100 | #321 | Tragic 28.8% |
| Tsimshian | 0.0 /100 | #322 | Tragic 28.8% |
| Fijians | 0.0 /100 | #323 | Tragic 28.7% |
| Dutch West Indians | 0.0 /100 | #324 | Tragic 28.5% |
| Pennsylvania Germans | 0.0 /100 | #325 | Tragic 28.4% |
| Apache | 0.0 /100 | #326 | Tragic 28.3% |
| Paiute | 0.0 /100 | #327 | Tragic 28.1% |
| Crow | 0.0 /100 | #328 | Tragic 27.7% |
| Immigrants | Central America | 0.0 /100 | #329 | Tragic 27.5% |
| Spanish American Indians | 0.0 /100 | #330 | Tragic 27.5% |
| Immigrants | Azores | 0.0 /100 | #331 | Tragic 27.3% |
| Menominee | 0.0 /100 | #332 | Tragic 27.3% |
| Mexicans | 0.0 /100 | #333 | Tragic 27.1% |
| Arapaho | 0.0 /100 | #334 | Tragic 26.6% |
| Natives/Alaskans | 0.0 /100 | #335 | Tragic 26.3% |
| Immigrants | Mexico | 0.0 /100 | #336 | Tragic 26.1% |
| Inupiat | 0.0 /100 | #337 | Tragic 25.8% |
| Pueblo | 0.0 /100 | #338 | Tragic 25.5% |
| Hopi | 0.0 /100 | #339 | Tragic 25.3% |
| Lumbee | 0.0 /100 | #340 | Tragic 24.8% |