Immigrants from Middle Africa vs Ecuadorian Bachelor's Degree
COMPARE
Immigrants from Middle Africa
Ecuadorian
Bachelor's Degree
Bachelor's Degree Comparison
Immigrants from Middle Africa
Ecuadorians
36.6%
BACHELOR'S DEGREE
20.6/ 100
METRIC RATING
207th/ 347
METRIC RANK
35.4%
BACHELOR'S DEGREE
6.6/ 100
METRIC RATING
227th/ 347
METRIC RANK
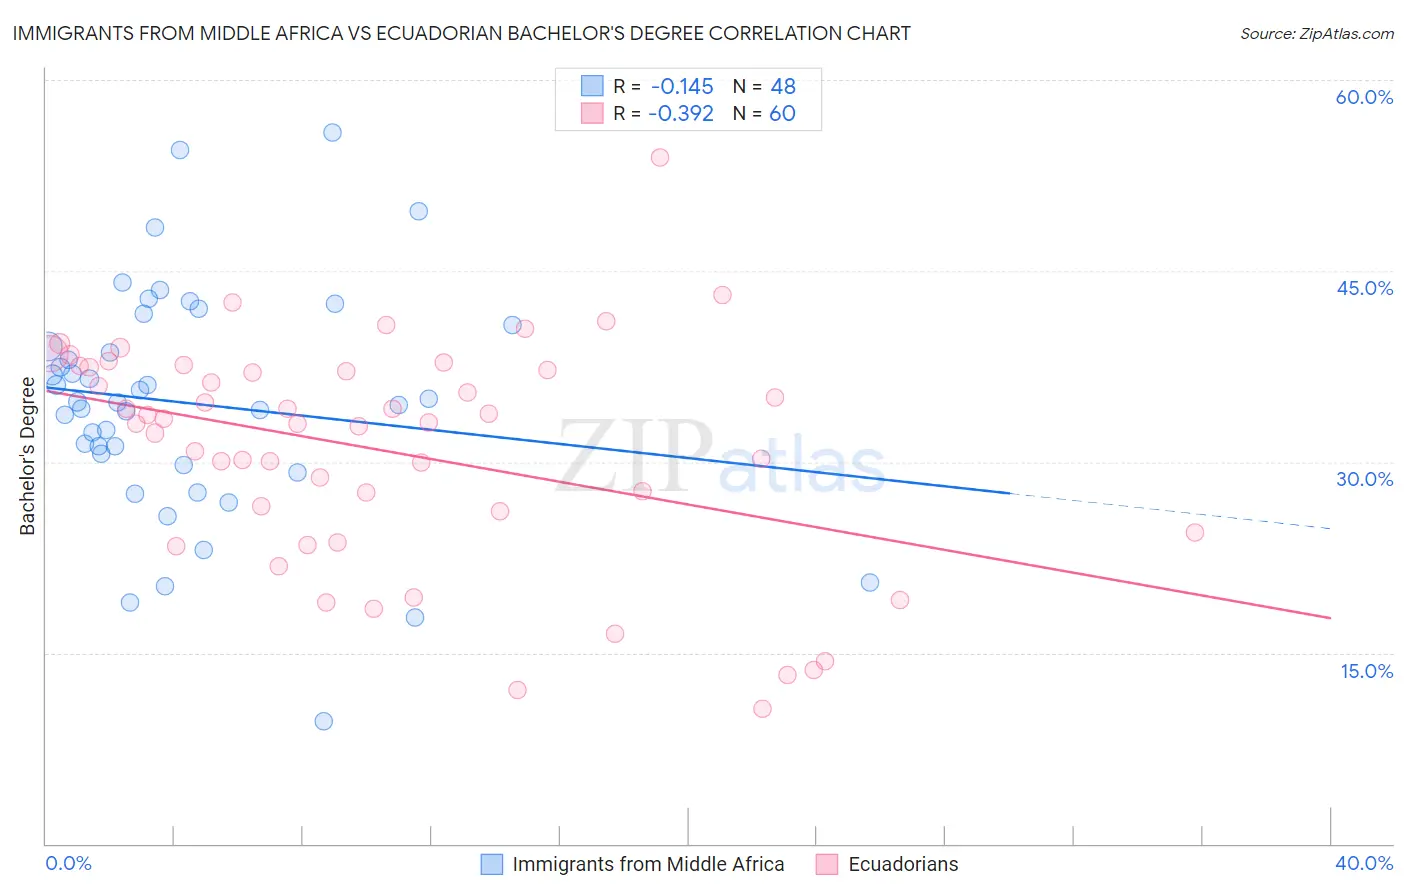
Immigrants from Middle Africa vs Ecuadorian Bachelor's Degree Correlation Chart
The statistical analysis conducted on geographies consisting of 202,742,104 people shows a poor negative correlation between the proportion of Immigrants from Middle Africa and percentage of population with at least bachelor's degree education in the United States with a correlation coefficient (R) of -0.145 and weighted average of 36.6%. Similarly, the statistical analysis conducted on geographies consisting of 317,830,457 people shows a mild negative correlation between the proportion of Ecuadorians and percentage of population with at least bachelor's degree education in the United States with a correlation coefficient (R) of -0.392 and weighted average of 35.4%, a difference of 3.4%.
Bachelor's Degree Correlation Summary
| Measurement | Immigrants from Middle Africa | Ecuadorian |
| Minimum | 9.6% | 10.6% |
| Maximum | 55.9% | 53.9% |
| Range | 46.3% | 43.3% |
| Mean | 34.6% | 30.9% |
| Median | 34.7% | 33.1% |
| Interquartile 25% (IQ1) | 30.2% | 25.3% |
| Interquartile 75% (IQ3) | 39.9% | 37.4% |
| Interquartile Range (IQR) | 9.7% | 12.1% |
| Standard Deviation (Sample) | 9.1% | 8.9% |
| Standard Deviation (Population) | 9.0% | 8.8% |
Demographics Similar to Immigrants from Middle Africa and Ecuadorians by Bachelor's Degree
In terms of bachelor's degree, the demographic groups most similar to Immigrants from Middle Africa are Immigrants from Thailand (36.5%, a difference of 0.19%), Panamanian (36.5%, a difference of 0.30%), French (36.5%, a difference of 0.32%), Scotch-Irish (36.4%, a difference of 0.38%), and Immigrants from Philippines (36.4%, a difference of 0.45%). Similarly, the demographic groups most similar to Ecuadorians are Portuguese (35.5%, a difference of 0.26%), Immigrants from Burma/Myanmar (35.5%, a difference of 0.30%), Immigrants from Barbados (35.5%, a difference of 0.37%), French Canadian (35.6%, a difference of 0.65%), and Trinidadian and Tobagonian (35.7%, a difference of 0.82%).
| Demographics | Rating | Rank | Bachelor's Degree |
| Immigrants | Middle Africa | 20.6 /100 | #207 | Fair 36.6% |
| Immigrants | Thailand | 19.4 /100 | #208 | Poor 36.5% |
| Panamanians | 18.8 /100 | #209 | Poor 36.5% |
| French | 18.6 /100 | #210 | Poor 36.5% |
| Scotch-Irish | 18.3 /100 | #211 | Poor 36.4% |
| Immigrants | Philippines | 17.8 /100 | #212 | Poor 36.4% |
| Immigrants | Panama | 14.2 /100 | #213 | Poor 36.2% |
| Germans | 13.9 /100 | #214 | Poor 36.1% |
| Immigrants | Western Africa | 13.8 /100 | #215 | Poor 36.1% |
| Barbadians | 13.5 /100 | #216 | Poor 36.1% |
| German Russians | 10.2 /100 | #217 | Poor 35.8% |
| Sub-Saharan Africans | 9.8 /100 | #218 | Tragic 35.8% |
| West Indians | 9.7 /100 | #219 | Tragic 35.8% |
| Spanish | 9.6 /100 | #220 | Tragic 35.8% |
| Dutch | 9.2 /100 | #221 | Tragic 35.7% |
| Trinidadians and Tobagonians | 8.8 /100 | #222 | Tragic 35.7% |
| French Canadians | 8.3 /100 | #223 | Tragic 35.6% |
| Immigrants | Barbados | 7.5 /100 | #224 | Tragic 35.5% |
| Immigrants | Burma/Myanmar | 7.3 /100 | #225 | Tragic 35.5% |
| Portuguese | 7.2 /100 | #226 | Tragic 35.5% |
| Ecuadorians | 6.6 /100 | #227 | Tragic 35.4% |