Immigrants from the Azores vs Tlingit-Haida 2nd Grade

COMPARE

Immigrants from the Azores
Race
Ancestry
AfghanAfricanAlaska NativeAlaskan AthabascanAlbanianAleutAlsatianAmericanApacheArabArapahoArgentineanArmenianAssyrian/Chaldean/SyriacAustralianAustrianBahamianBangladeshiBarbadianBasqueBelgianBelizeanBermudanBhutaneseBlackfeetBolivianBrazilianBritishBritish West IndianBulgarianBurmeseCajunCambodianCanadianCape VerdeanCarpatho RusynCelticCentral AmericanCentral American IndianCherokeeCheyenneChickasawChileanChineseChippewaChoctawColombianColvilleComancheCosta RicanCreeCreekCroatianCrowCubanCypriotCzechCzechoslovakianDanishDelawareDominicanDutchDutch West IndianEastern EuropeanEcuadorianEgyptianEnglishEstonianEthiopianEuropeanFijianFilipinoFinnishFrenchFrench American IndianFrench CanadianGermanGerman RussianGhanaianGreekGuamanian/ChamorroGuatemalanGuyaneseHaitianHmongHonduranHopiHoumaHungarianIcelanderIndian (Asian)IndonesianInupiatIranianIraqiIrishIroquoisIsraeliItalianJamaicanJapaneseJordanianKenyanKiowaKoreanLaotianLatvianLebaneseLiberianLithuanianLumbeeLuxembourgerMacedonianMalaysianMalteseMarshalleseMenomineeMexicanMexican American IndianMongolianMoroccanNative HawaiianNavajoNepaleseNew ZealanderNicaraguanNigerianNorthern EuropeanNorwegianOkinawanOsageOttawaPaiutePakistaniPalestinianPanamanianParaguayanPennsylvania GermanPeruvianPimaPolishPortuguesePotawatomiPuebloPuerto RicanPuget Sound SalishRomanianRussianSalvadoranSamoanScandinavianScotch-IrishScottishSeminoleSenegaleseSerbianShoshoneSierra LeoneanSiouxSlavicSlovakSloveneSomaliSouth AfricanSouth AmericanSouth American IndianSoviet UnionSpaniardSpanishSpanish AmericanSpanish American IndianSri LankanSubsaharan AfricanSudaneseSwedishSwissSyrianTaiwaneseThaiTohono O'OdhamTonganTrinidadian and TobagonianTsimshianTurkishU.S. Virgin IslanderUgandanUkrainianUruguayanUteVenezuelanVietnameseWelshWest IndianYakamaYaquiYugoslavianYumanYup'ikZimbabwean
Immigration
NonimmigrantsImmigrantsAfghanistanAfricaAlbaniaArgentinaArmeniaAsiaAustraliaAustriaBahamasBangladeshBarbadosBelarusBelgiumBelizeBoliviaBosnia and HerzegovinaBrazilBulgariaBurma/MyanmarCabo VerdeCambodiaCameroonCanadaCaribbeanCentral AmericaChileChinaColombiaCongoCosta RicaCroatiaCubaCzechoslovakiaDenmarkDominicaDominican RepublicEastern AfricaEastern AsiaEastern EuropeEcuadorEgyptEl SalvadorEnglandEritreaEthiopiaEuropeFijiFranceGermanyGhanaGreeceGrenadaGuatemalaGuyanaHaitiHondurasHong KongHungaryIndiaIndonesiaIranIraqIrelandIsraelItalyJamaicaJapanJordanKazakhstanKenyaKoreaKuwaitLaosLatin AmericaLatviaLebanonLiberiaLithuaniaMalaysiaMexicoMicronesiaMiddle AfricaMoldovaMoroccoNepalNetherlandsNicaraguaNigeriaNorth AmericaNorth MacedoniaNorthern AfricaNorthern EuropeNorwayOceaniaPakistanPanamaPeruPhilippinesPolandPortugalRomaniaRussiaSaudi ArabiaScotlandSenegalSerbiaSierra LeoneSingaporeSomaliaSouth AfricaSouth AmericaSouth Central AsiaSouth Eastern AsiaSouthern EuropeSpainSri LankaSt. Vincent and the GrenadinesSudanSwedenSwitzerlandSyriaTaiwanThailandTrinidad and TobagoTurkeyUgandaUkraineUruguayUzbekistanVenezuelaVietnamWest IndiesWestern AfricaWestern AsiaWestern EuropeYemenZaireZimbabweAzores
Tlingit-Haida
Race
Ancestry
AfghanAfricanAlaska NativeAlaskan AthabascanAlbanianAleutAlsatianAmericanApacheArabArapahoArgentineanArmenianAssyrian/Chaldean/SyriacAustralianAustrianBahamianBangladeshiBarbadianBasqueBelgianBelizeanBermudanBhutaneseBlackfeetBolivianBrazilianBritishBritish West IndianBulgarianBurmeseCajunCambodianCanadianCape VerdeanCarpatho RusynCelticCentral AmericanCentral American IndianCherokeeCheyenneChickasawChileanChineseChippewaChoctawColombianColvilleComancheCosta RicanCreeCreekCroatianCrowCubanCypriotCzechCzechoslovakianDanishDelawareDominicanDutchDutch West IndianEastern EuropeanEcuadorianEgyptianEnglishEstonianEthiopianEuropeanFijianFilipinoFinnishFrenchFrench American IndianFrench CanadianGermanGerman RussianGhanaianGreekGuamanian/ChamorroGuatemalanGuyaneseHaitianHmongHonduranHopiHoumaHungarianIcelanderIndian (Asian)IndonesianInupiatIranianIraqiIrishIroquoisIsraeliItalianJamaicanJapaneseJordanianKenyanKiowaKoreanLaotianLatvianLebaneseLiberianLithuanianLumbeeLuxembourgerMacedonianMalaysianMalteseMarshalleseMenomineeMexicanMexican American IndianMongolianMoroccanNative HawaiianNavajoNepaleseNew ZealanderNicaraguanNigerianNorthern EuropeanNorwegianOkinawanOsageOttawaPaiutePakistaniPalestinianPanamanianParaguayanPennsylvania GermanPeruvianPimaPolishPortuguesePotawatomiPuebloPuerto RicanPuget Sound SalishRomanianRussianSalvadoranSamoanScandinavianScotch-IrishScottishSeminoleSenegaleseSerbianShoshoneSierra LeoneanSiouxSlavicSlovakSloveneSomaliSouth AfricanSouth AmericanSouth American IndianSoviet UnionSpaniardSpanishSpanish AmericanSpanish American IndianSri LankanSubsaharan AfricanSudaneseSwedishSwissSyrianTaiwaneseThaiTlingit-HaidaTohono O'OdhamTonganTrinidadian and TobagonianTsimshianTurkishU.S. Virgin IslanderUgandanUkrainianUruguayanUteVenezuelanVietnameseWelshWest IndianYakamaYaquiYugoslavianYumanYup'ikZimbabwean
Immigration
NonimmigrantsImmigrantsAfghanistanAfricaAlbaniaArgentinaArmeniaAsiaAustraliaAustriaBahamasBangladeshBarbadosBelarusBelgiumBelizeBoliviaBosnia and HerzegovinaBrazilBulgariaBurma/MyanmarCabo VerdeCambodiaCameroonCanadaCaribbeanCentral AmericaChileChinaColombiaCongoCosta RicaCroatiaCubaCzechoslovakiaDenmarkDominicaDominican RepublicEastern AfricaEastern AsiaEastern EuropeEcuadorEgyptEl SalvadorEnglandEritreaEthiopiaEuropeFijiFranceGermanyGhanaGreeceGrenadaGuatemalaGuyanaHaitiHondurasHong KongHungaryIndiaIndonesiaIranIraqIrelandIsraelItalyJamaicaJapanJordanKazakhstanKenyaKoreaKuwaitLaosLatin AmericaLatviaLebanonLiberiaLithuaniaMalaysiaMexicoMicronesiaMiddle AfricaMoldovaMoroccoNepalNetherlandsNicaraguaNigeriaNorth AmericaNorth MacedoniaNorthern AfricaNorthern EuropeNorwayOceaniaPakistanPanamaPeruPhilippinesPolandPortugalRomaniaRussiaSaudi ArabiaScotlandSenegalSerbiaSierra LeoneSingaporeSomaliaSouth AfricaSouth AmericaSouth Central AsiaSouth Eastern AsiaSouthern EuropeSpainSri LankaSt. Vincent and the GrenadinesSudanSwedenSwitzerlandSyriaTaiwanThailandTrinidad and TobagoTurkeyUgandaUkraineUruguayUzbekistanVenezuelaVietnamWest IndiesWestern AfricaWestern AsiaWestern EuropeYemenZaireZimbabwe
2nd Grade
Income
Poverty
Unemployment
Labor Participation
Family Structure
Vehicle Availability
Education Level
Disability

2nd Grade Comparison

Immigrants from the Azores

Tlingit-Haida

Tragic
Exceptional
96.8%
2ND GRADE
0.0/ 100
METRIC RATING
307th/ 347
METRIC RANK
98.6%
2ND GRADE
100.0/ 100
METRIC RATING
11th/ 347
METRIC RANK

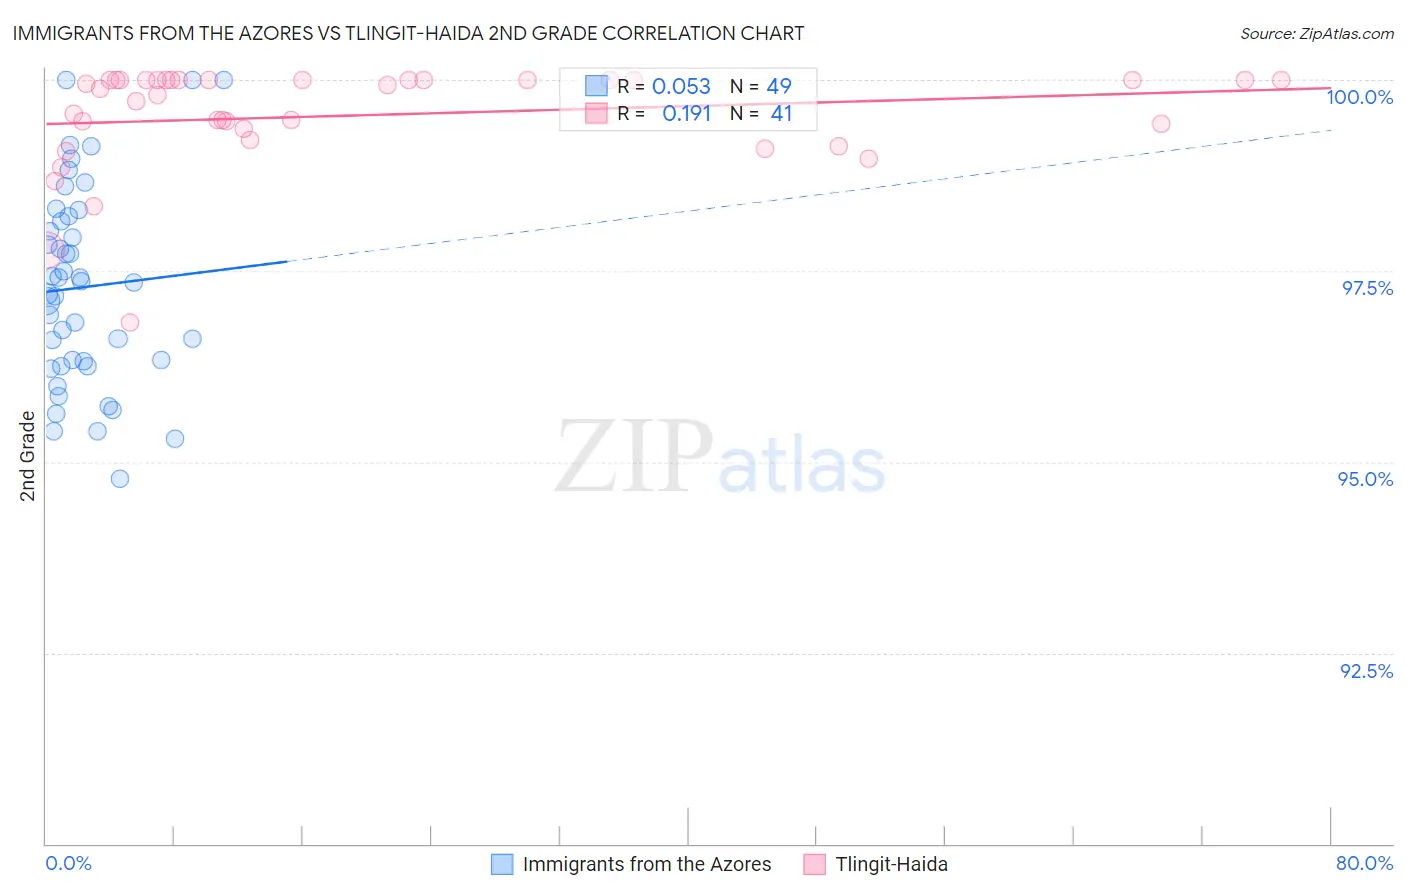
Immigrants from the Azores vs Tlingit-Haida 2nd Grade Correlation Chart

The statistical analysis conducted on geographies consisting of 46,257,310 people shows a slight positive correlation between the proportion of Immigrants from the Azores and percentage of population with at least 2nd grade education in the United States with a correlation coefficient (R) of 0.053 and weighted average of 96.8%. Similarly, the statistical analysis conducted on geographies consisting of 60,865,648 people shows a poor positive correlation between the proportion of Tlingit-Haida and percentage of population with at least 2nd grade education in the United States with a correlation coefficient (R) of 0.191 and weighted average of 98.6%, a difference of 1.8%.
Immigrants from the Azores vs Tlingit-Haida 2nd Grade

2nd Grade Correlation Summary

MeasurementImmigrants from the AzoresTlingit-Haida
Minimum94.8%96.8%
Maximum100.0%100.0%
Range5.2%3.2%
Mean97.3%99.5%
Median97.3%99.9%
Interquartile 25% (IQ1)96.3%99.3%
Interquartile 75% (IQ3)98.2%100.0%
Interquartile Range (IQR)1.9%0.71%
Standard Deviation (Sample)1.3%0.68%
Standard Deviation (Population)1.3%0.67%

Similar Demographics by 2nd Grade

Demographics Similar to Immigrants from the Azores by 2nd Grade

In terms of 2nd grade, the demographic groups most similar to Immigrants from the Azores are Immigrants from Haiti (96.8%, a difference of 0.010%), Belizean (96.8%, a difference of 0.010%), Sri Lankan (96.8%, a difference of 0.020%), Guyanese (96.8%, a difference of 0.020%), and Immigrants from Somalia (96.9%, a difference of 0.030%).
DemographicsRating | Rank2nd Grade
Immigrants | South Eastern Asia
0.0
/100
|
#300
Tragic
97.0%
Central American Indians
0.0
/100
|
#301
Tragic
97.0%
Somalis
0.0
/100
|
#302
Tragic
97.0%
Ecuadorians
0.0
/100
|
#303
Tragic
96.9%
Immigrants | Caribbean
0.0
/100
|
#304
Tragic
96.9%
Nicaraguans
0.0
/100
|
#305
Tragic
96.9%
Immigrants | Somalia
0.0
/100
|
#306
Tragic
96.9%
Immigrants | Azores
0.0
/100
|
#307
Tragic
96.8%
Immigrants | Haiti
0.0
/100
|
#308
Tragic
96.8%
Belizeans
0.0
/100
|
#309
Tragic
96.8%
Sri Lankans
0.0
/100
|
#310
Tragic
96.8%
Guyanese
0.0
/100
|
#311
Tragic
96.8%
Cape Verdeans
0.0
/100
|
#312
Tragic
96.8%
Hispanics or Latinos
0.0
/100
|
#313
Tragic
96.8%
Immigrants | Ecuador
0.0
/100
|
#314
Tragic
96.8%

Demographics Similar to Tlingit-Haida by 2nd Grade

In terms of 2nd grade, the demographic groups most similar to Tlingit-Haida are Slovene (98.6%, a difference of 0.0%), Carpatho Rusyn (98.6%, a difference of 0.010%), English (98.6%, a difference of 0.010%), Swedish (98.6%, a difference of 0.020%), and German (98.7%, a difference of 0.030%).
DemographicsRating | Rank2nd Grade
Tsimshian
100.0
/100
|
#4
Exceptional
98.8%
Alaskan Athabascans
100.0
/100
|
#5
Exceptional
98.7%
Alaska Natives
100.0
/100
|
#6
Exceptional
98.7%
Norwegians
100.0
/100
|
#7
Exceptional
98.7%
Germans
100.0
/100
|
#8
Exceptional
98.7%
Slovaks
100.0
/100
|
#9
Exceptional
98.7%
Slovenes
100.0
/100
|
#10
Exceptional
98.6%
Tlingit-Haida
100.0
/100
|
#11
Exceptional
98.6%
Carpatho Rusyns
100.0
/100
|
#12
Exceptional
98.6%
English
100.0
/100
|
#13
Exceptional
98.6%
Swedes
100.0
/100
|
#14
Exceptional
98.6%
Scottish
100.0
/100
|
#15
Exceptional
98.6%
Dutch
100.0
/100
|
#16
Exceptional
98.6%
Aleuts
100.0
/100
|
#17
Exceptional
98.6%
Irish
100.0
/100
|
#18
Exceptional
98.6%