Immigrants from Singapore vs Tlingit-Haida 2nd Grade
COMPARE
Immigrants from Singapore
Tlingit-Haida
2nd Grade
2nd Grade Comparison
Immigrants from Singapore
Tlingit-Haida
98.1%
2ND GRADE
97.0/ 100
METRIC RATING
110th/ 347
METRIC RANK
98.6%
2ND GRADE
100.0/ 100
METRIC RATING
11th/ 347
METRIC RANK
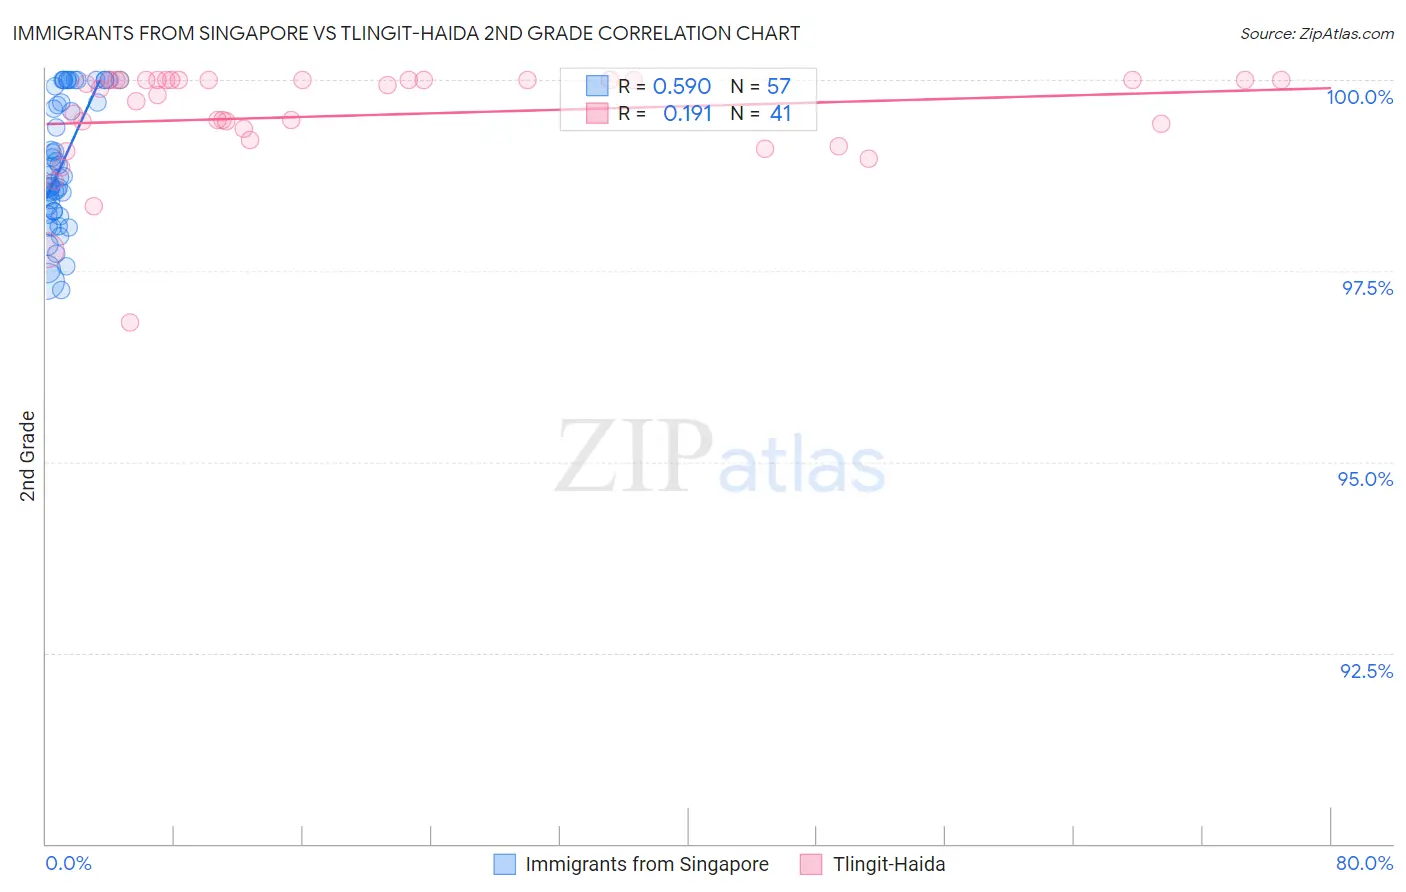
Immigrants from Singapore vs Tlingit-Haida 2nd Grade Correlation Chart
The statistical analysis conducted on geographies consisting of 137,521,700 people shows a substantial positive correlation between the proportion of Immigrants from Singapore and percentage of population with at least 2nd grade education in the United States with a correlation coefficient (R) of 0.590 and weighted average of 98.1%. Similarly, the statistical analysis conducted on geographies consisting of 60,865,648 people shows a poor positive correlation between the proportion of Tlingit-Haida and percentage of population with at least 2nd grade education in the United States with a correlation coefficient (R) of 0.191 and weighted average of 98.6%, a difference of 0.50%.
2nd Grade Correlation Summary
| Measurement | Immigrants from Singapore | Tlingit-Haida |
| Minimum | 97.2% | 96.8% |
| Maximum | 100.0% | 100.0% |
| Range | 2.8% | 3.2% |
| Mean | 98.9% | 99.5% |
| Median | 98.7% | 99.9% |
| Interquartile 25% (IQ1) | 98.3% | 99.3% |
| Interquartile 75% (IQ3) | 99.8% | 100.0% |
| Interquartile Range (IQR) | 1.5% | 0.71% |
| Standard Deviation (Sample) | 0.83% | 0.68% |
| Standard Deviation (Population) | 0.82% | 0.67% |
Similar Demographics by 2nd Grade
Demographics Similar to Immigrants from Singapore by 2nd Grade
In terms of 2nd grade, the demographic groups most similar to Immigrants from Singapore are Immigrants from Czechoslovakia (98.1%, a difference of 0.0%), Bhutanese (98.1%, a difference of 0.010%), German Russian (98.1%, a difference of 0.010%), Immigrants from Switzerland (98.1%, a difference of 0.010%), and Basque (98.1%, a difference of 0.010%).
| Demographics | Rating | Rank | 2nd Grade |
| Pima | 97.6 /100 | #103 | Exceptional 98.2% |
| Turks | 97.6 /100 | #104 | Exceptional 98.2% |
| Yugoslavians | 97.5 /100 | #105 | Exceptional 98.2% |
| Bhutanese | 97.5 /100 | #106 | Exceptional 98.1% |
| German Russians | 97.4 /100 | #107 | Exceptional 98.1% |
| Immigrants | Switzerland | 97.3 /100 | #108 | Exceptional 98.1% |
| Basques | 97.2 /100 | #109 | Exceptional 98.1% |
| Immigrants | Singapore | 97.0 /100 | #110 | Exceptional 98.1% |
| Immigrants | Czechoslovakia | 96.9 /100 | #111 | Exceptional 98.1% |
| Colville | 96.6 /100 | #112 | Exceptional 98.1% |
| Immigrants | Norway | 96.5 /100 | #113 | Exceptional 98.1% |
| Immigrants | Latvia | 96.4 /100 | #114 | Exceptional 98.1% |
| Iranians | 95.9 /100 | #115 | Exceptional 98.1% |
| Spanish | 95.8 /100 | #116 | Exceptional 98.1% |
| Ute | 95.7 /100 | #117 | Exceptional 98.1% |
Demographics Similar to Tlingit-Haida by 2nd Grade
In terms of 2nd grade, the demographic groups most similar to Tlingit-Haida are Slovene (98.6%, a difference of 0.0%), Carpatho Rusyn (98.6%, a difference of 0.010%), English (98.6%, a difference of 0.010%), Swedish (98.6%, a difference of 0.020%), and German (98.7%, a difference of 0.030%).
| Demographics | Rating | Rank | 2nd Grade |
| Tsimshian | 100.0 /100 | #4 | Exceptional 98.8% |
| Alaskan Athabascans | 100.0 /100 | #5 | Exceptional 98.7% |
| Alaska Natives | 100.0 /100 | #6 | Exceptional 98.7% |
| Norwegians | 100.0 /100 | #7 | Exceptional 98.7% |
| Germans | 100.0 /100 | #8 | Exceptional 98.7% |
| Slovaks | 100.0 /100 | #9 | Exceptional 98.7% |
| Slovenes | 100.0 /100 | #10 | Exceptional 98.6% |
| Tlingit-Haida | 100.0 /100 | #11 | Exceptional 98.6% |
| Carpatho Rusyns | 100.0 /100 | #12 | Exceptional 98.6% |
| English | 100.0 /100 | #13 | Exceptional 98.6% |
| Swedes | 100.0 /100 | #14 | Exceptional 98.6% |
| Scottish | 100.0 /100 | #15 | Exceptional 98.6% |
| Dutch | 100.0 /100 | #16 | Exceptional 98.6% |
| Aleuts | 100.0 /100 | #17 | Exceptional 98.6% |
| Irish | 100.0 /100 | #18 | Exceptional 98.6% |