Immigrants from the Azores vs Tlingit-Haida Vision Disability
COMPARE
Immigrants from the Azores
Tlingit-Haida
Vision Disability
Vision Disability Comparison
Immigrants from the Azores
Tlingit-Haida
2.4%
VISION DISABILITY
0.1/ 100
METRIC RATING
271st/ 347
METRIC RANK
2.9%
VISION DISABILITY
0.0/ 100
METRIC RATING
323rd/ 347
METRIC RANK
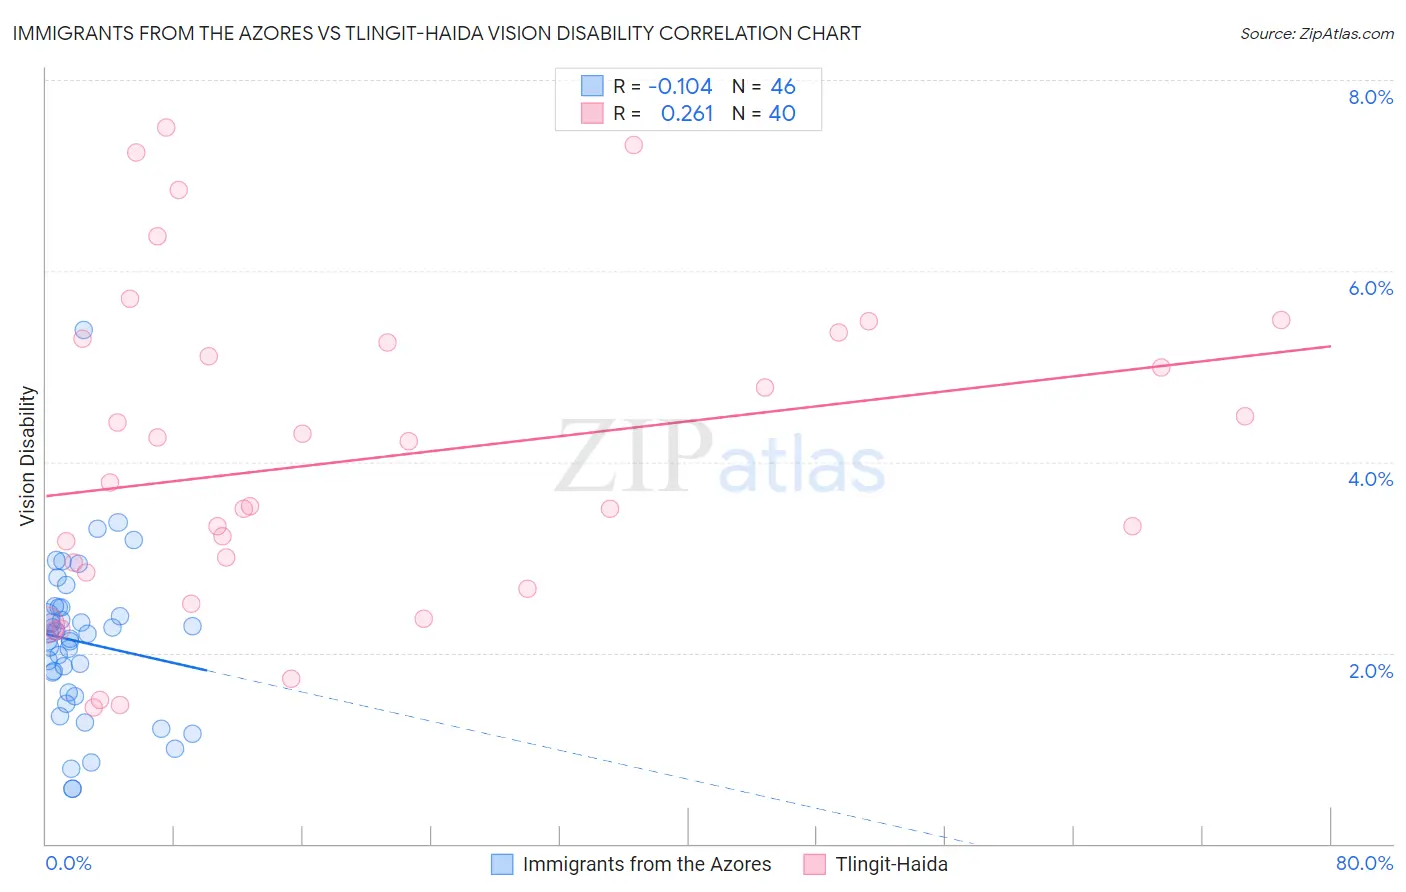
Immigrants from the Azores vs Tlingit-Haida Vision Disability Correlation Chart
The statistical analysis conducted on geographies consisting of 46,255,686 people shows a poor negative correlation between the proportion of Immigrants from the Azores and percentage of population with vision disability in the United States with a correlation coefficient (R) of -0.104 and weighted average of 2.4%. Similarly, the statistical analysis conducted on geographies consisting of 60,836,708 people shows a weak positive correlation between the proportion of Tlingit-Haida and percentage of population with vision disability in the United States with a correlation coefficient (R) of 0.261 and weighted average of 2.9%, a difference of 18.3%.
Vision Disability Correlation Summary
| Measurement | Immigrants from the Azores | Tlingit-Haida |
| Minimum | 0.57% | 1.4% |
| Maximum | 5.4% | 7.5% |
| Range | 4.8% | 6.1% |
| Mean | 2.1% | 4.0% |
| Median | 2.2% | 3.7% |
| Interquartile 25% (IQ1) | 1.6% | 2.8% |
| Interquartile 75% (IQ3) | 2.5% | 5.3% |
| Interquartile Range (IQR) | 0.89% | 2.5% |
| Standard Deviation (Sample) | 0.85% | 1.7% |
| Standard Deviation (Population) | 0.84% | 1.7% |
Similar Demographics by Vision Disability
Demographics Similar to Immigrants from the Azores by Vision Disability
In terms of vision disability, the demographic groups most similar to Immigrants from the Azores are Spaniard (2.4%, a difference of 0.10%), Celtic (2.4%, a difference of 0.16%), Cuban (2.4%, a difference of 0.16%), Immigrants from Bahamas (2.4%, a difference of 0.43%), and Senegalese (2.4%, a difference of 0.44%).
| Demographics | Rating | Rank | Vision Disability |
| Immigrants | Liberia | 0.1 /100 | #264 | Tragic 2.4% |
| Immigrants | Jamaica | 0.1 /100 | #265 | Tragic 2.4% |
| Mexican American Indians | 0.1 /100 | #266 | Tragic 2.4% |
| Ute | 0.1 /100 | #267 | Tragic 2.4% |
| Senegalese | 0.1 /100 | #268 | Tragic 2.4% |
| Celtics | 0.1 /100 | #269 | Tragic 2.4% |
| Cubans | 0.1 /100 | #270 | Tragic 2.4% |
| Immigrants | Azores | 0.1 /100 | #271 | Tragic 2.4% |
| Spaniards | 0.1 /100 | #272 | Tragic 2.4% |
| Immigrants | Bahamas | 0.1 /100 | #273 | Tragic 2.4% |
| Immigrants | Latin America | 0.0 /100 | #274 | Tragic 2.4% |
| Chippewa | 0.0 /100 | #275 | Tragic 2.4% |
| Scotch-Irish | 0.0 /100 | #276 | Tragic 2.4% |
| Bahamians | 0.0 /100 | #277 | Tragic 2.4% |
| Spanish | 0.0 /100 | #278 | Tragic 2.4% |
Demographics Similar to Tlingit-Haida by Vision Disability
In terms of vision disability, the demographic groups most similar to Tlingit-Haida are Paiute (2.9%, a difference of 0.0%), Comanche (2.8%, a difference of 0.42%), Hopi (2.9%, a difference of 2.0%), Cherokee (2.9%, a difference of 2.0%), and Black/African American (2.8%, a difference of 2.5%).
| Demographics | Rating | Rank | Vision Disability |
| Shoshone | 0.0 /100 | #316 | Tragic 2.7% |
| Yup'ik | 0.0 /100 | #317 | Tragic 2.7% |
| Alaska Natives | 0.0 /100 | #318 | Tragic 2.7% |
| Tohono O'odham | 0.0 /100 | #319 | Tragic 2.8% |
| Blacks/African Americans | 0.0 /100 | #320 | Tragic 2.8% |
| Comanche | 0.0 /100 | #321 | Tragic 2.8% |
| Paiute | 0.0 /100 | #322 | Tragic 2.9% |
| Tlingit-Haida | 0.0 /100 | #323 | Tragic 2.9% |
| Hopi | 0.0 /100 | #324 | Tragic 2.9% |
| Cherokee | 0.0 /100 | #325 | Tragic 2.9% |
| Spanish Americans | 0.0 /100 | #326 | Tragic 2.9% |
| Natives/Alaskans | 0.0 /100 | #327 | Tragic 3.0% |
| Yuman | 0.0 /100 | #328 | Tragic 3.0% |
| Apache | 0.0 /100 | #329 | Tragic 3.0% |
| Colville | 0.0 /100 | #330 | Tragic 3.0% |