Immigrants from the Azores vs Italian 2nd Grade
COMPARE
Immigrants from the Azores
Italian
2nd Grade
2nd Grade Comparison
Immigrants from the Azores
Italians
96.8%
2ND GRADE
0.0/ 100
METRIC RATING
307th/ 347
METRIC RANK
98.4%
2ND GRADE
99.9/ 100
METRIC RATING
37th/ 347
METRIC RANK
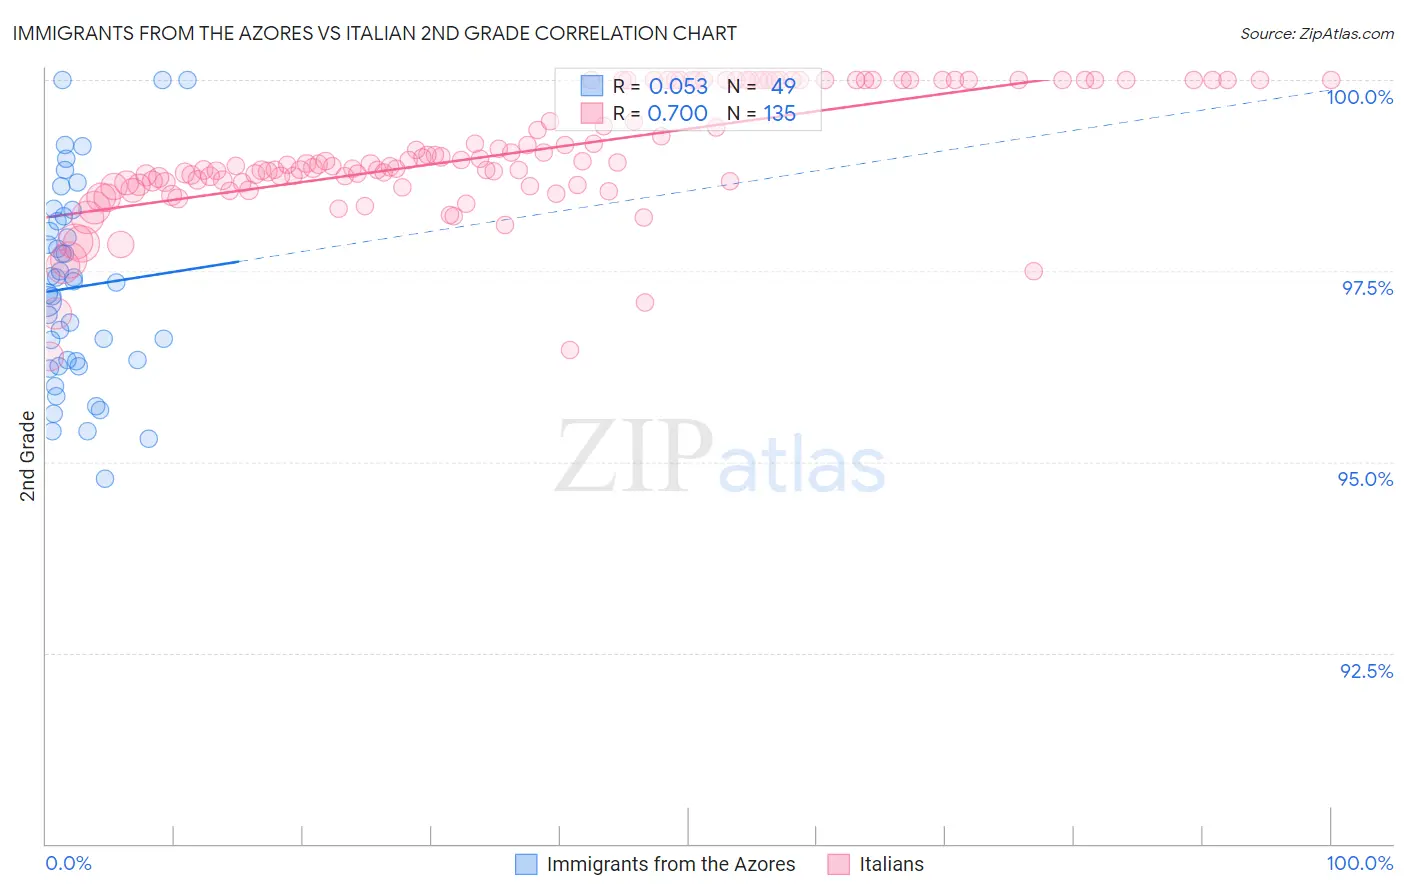
Immigrants from the Azores vs Italian 2nd Grade Correlation Chart
The statistical analysis conducted on geographies consisting of 46,257,310 people shows a slight positive correlation between the proportion of Immigrants from the Azores and percentage of population with at least 2nd grade education in the United States with a correlation coefficient (R) of 0.053 and weighted average of 96.8%. Similarly, the statistical analysis conducted on geographies consisting of 575,115,824 people shows a significant positive correlation between the proportion of Italians and percentage of population with at least 2nd grade education in the United States with a correlation coefficient (R) of 0.700 and weighted average of 98.4%, a difference of 1.7%.
2nd Grade Correlation Summary
| Measurement | Immigrants from the Azores | Italian |
| Minimum | 94.8% | 96.4% |
| Maximum | 100.0% | 100.0% |
| Range | 5.2% | 3.6% |
| Mean | 97.3% | 99.0% |
| Median | 97.3% | 98.9% |
| Interquartile 25% (IQ1) | 96.3% | 98.7% |
| Interquartile 75% (IQ3) | 98.2% | 100.0% |
| Interquartile Range (IQR) | 1.9% | 1.3% |
| Standard Deviation (Sample) | 1.3% | 0.78% |
| Standard Deviation (Population) | 1.3% | 0.78% |
Similar Demographics by 2nd Grade
Demographics Similar to Immigrants from the Azores by 2nd Grade
In terms of 2nd grade, the demographic groups most similar to Immigrants from the Azores are Immigrants from Haiti (96.8%, a difference of 0.010%), Belizean (96.8%, a difference of 0.010%), Sri Lankan (96.8%, a difference of 0.020%), Guyanese (96.8%, a difference of 0.020%), and Immigrants from Somalia (96.9%, a difference of 0.030%).
| Demographics | Rating | Rank | 2nd Grade |
| Immigrants | South Eastern Asia | 0.0 /100 | #300 | Tragic 97.0% |
| Central American Indians | 0.0 /100 | #301 | Tragic 97.0% |
| Somalis | 0.0 /100 | #302 | Tragic 97.0% |
| Ecuadorians | 0.0 /100 | #303 | Tragic 96.9% |
| Immigrants | Caribbean | 0.0 /100 | #304 | Tragic 96.9% |
| Nicaraguans | 0.0 /100 | #305 | Tragic 96.9% |
| Immigrants | Somalia | 0.0 /100 | #306 | Tragic 96.9% |
| Immigrants | Azores | 0.0 /100 | #307 | Tragic 96.8% |
| Immigrants | Haiti | 0.0 /100 | #308 | Tragic 96.8% |
| Belizeans | 0.0 /100 | #309 | Tragic 96.8% |
| Sri Lankans | 0.0 /100 | #310 | Tragic 96.8% |
| Guyanese | 0.0 /100 | #311 | Tragic 96.8% |
| Cape Verdeans | 0.0 /100 | #312 | Tragic 96.8% |
| Hispanics or Latinos | 0.0 /100 | #313 | Tragic 96.8% |
| Immigrants | Ecuador | 0.0 /100 | #314 | Tragic 96.8% |
Demographics Similar to Italians by 2nd Grade
In terms of 2nd grade, the demographic groups most similar to Italians are Latvian (98.4%, a difference of 0.010%), Chippewa (98.4%, a difference of 0.010%), British (98.5%, a difference of 0.020%), Luxembourger (98.4%, a difference of 0.020%), and Eastern European (98.4%, a difference of 0.020%).
| Demographics | Rating | Rank | 2nd Grade |
| Europeans | 100.0 /100 | #30 | Exceptional 98.5% |
| Czechs | 100.0 /100 | #31 | Exceptional 98.5% |
| French Canadians | 100.0 /100 | #32 | Exceptional 98.5% |
| Scandinavians | 100.0 /100 | #33 | Exceptional 98.5% |
| Chinese | 100.0 /100 | #34 | Exceptional 98.5% |
| Swiss | 100.0 /100 | #35 | Exceptional 98.5% |
| British | 100.0 /100 | #36 | Exceptional 98.5% |
| Italians | 99.9 /100 | #37 | Exceptional 98.4% |
| Latvians | 99.9 /100 | #38 | Exceptional 98.4% |
| Chippewa | 99.9 /100 | #39 | Exceptional 98.4% |
| Luxembourgers | 99.9 /100 | #40 | Exceptional 98.4% |
| Eastern Europeans | 99.9 /100 | #41 | Exceptional 98.4% |
| Native Hawaiians | 99.9 /100 | #42 | Exceptional 98.4% |
| Belgians | 99.9 /100 | #43 | Exceptional 98.4% |
| Northern Europeans | 99.9 /100 | #44 | Exceptional 98.4% |