Honduran vs Delaware Master's Degree
COMPARE
Honduran
Delaware
Master's Degree
Master's Degree Comparison
Hondurans
Delaware
11.9%
MASTER'S DEGREE
0.2/ 100
METRIC RATING
283rd/ 347
METRIC RANK
13.0%
MASTER'S DEGREE
1.7/ 100
METRIC RATING
244th/ 347
METRIC RANK
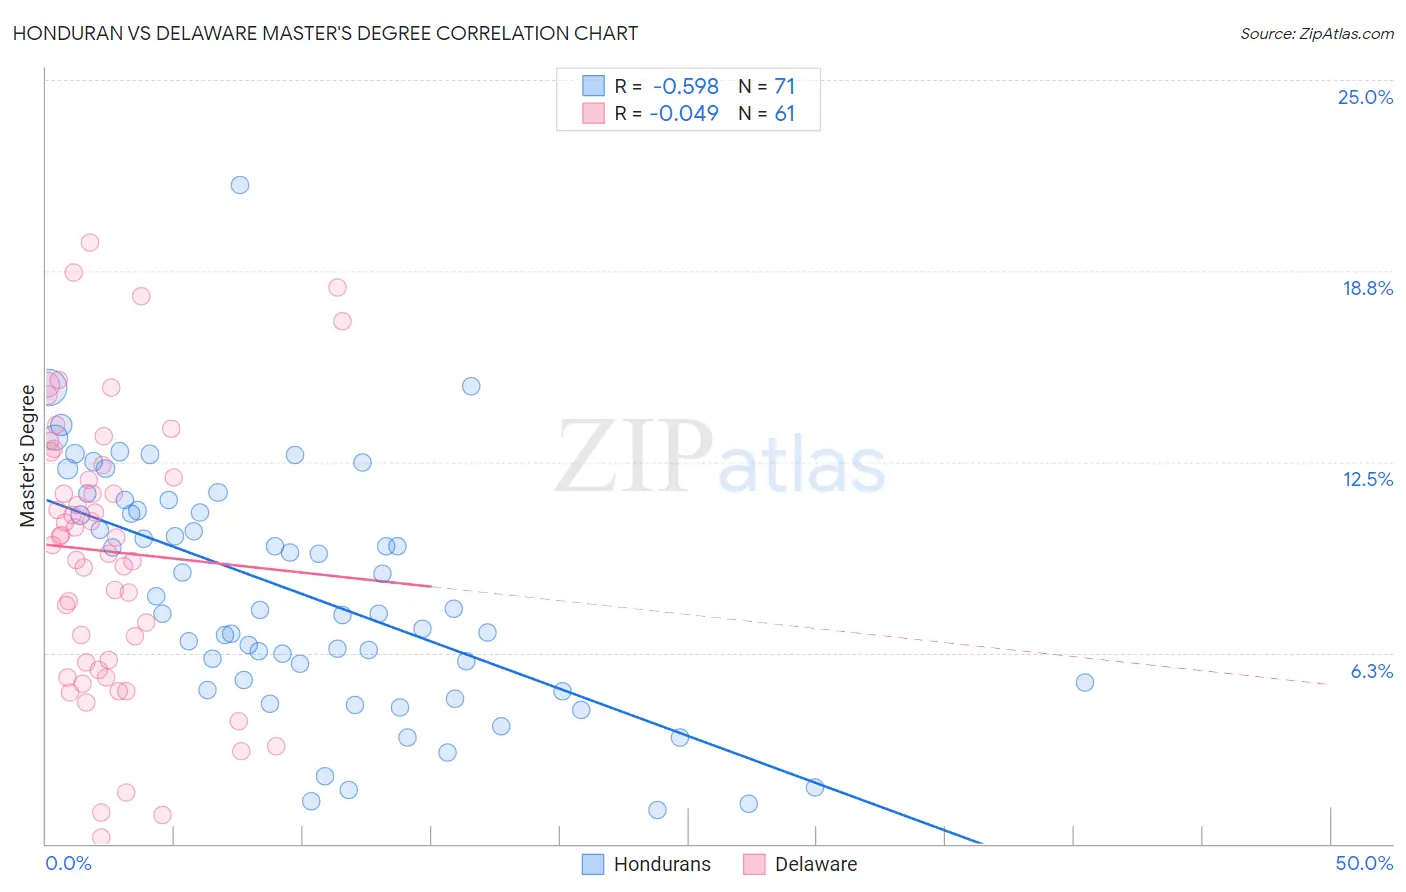
Honduran vs Delaware Master's Degree Correlation Chart
The statistical analysis conducted on geographies consisting of 357,698,981 people shows a substantial negative correlation between the proportion of Hondurans and percentage of population with at least master's degree education in the United States with a correlation coefficient (R) of -0.598 and weighted average of 11.9%. Similarly, the statistical analysis conducted on geographies consisting of 96,222,112 people shows no correlation between the proportion of Delaware and percentage of population with at least master's degree education in the United States with a correlation coefficient (R) of -0.049 and weighted average of 13.0%, a difference of 8.7%.
Master's Degree Correlation Summary
| Measurement | Honduran | Delaware |
| Minimum | 1.1% | 0.20% |
| Maximum | 21.5% | 19.7% |
| Range | 20.4% | 19.5% |
| Mean | 8.2% | 9.6% |
| Median | 7.6% | 10.0% |
| Interquartile 25% (IQ1) | 5.3% | 5.8% |
| Interquartile 75% (IQ3) | 10.9% | 12.6% |
| Interquartile Range (IQR) | 5.6% | 6.8% |
| Standard Deviation (Sample) | 3.9% | 4.6% |
| Standard Deviation (Population) | 3.9% | 4.5% |
Similar Demographics by Master's Degree
Demographics Similar to Hondurans by Master's Degree
In terms of master's degree, the demographic groups most similar to Hondurans are Immigrants from El Salvador (12.0%, a difference of 0.41%), Malaysian (12.0%, a difference of 0.72%), Ottawa (11.9%, a difference of 0.72%), Immigrants from Dominican Republic (12.1%, a difference of 0.85%), and Immigrants from Belize (12.1%, a difference of 0.90%).
| Demographics | Rating | Rank | Master's Degree |
| Blacks/African Americans | 0.3 /100 | #276 | Tragic 12.1% |
| Immigrants | Caribbean | 0.3 /100 | #277 | Tragic 12.1% |
| Potawatomi | 0.3 /100 | #278 | Tragic 12.1% |
| Immigrants | Belize | 0.2 /100 | #279 | Tragic 12.1% |
| Immigrants | Dominican Republic | 0.2 /100 | #280 | Tragic 12.1% |
| Malaysians | 0.2 /100 | #281 | Tragic 12.0% |
| Immigrants | El Salvador | 0.2 /100 | #282 | Tragic 12.0% |
| Hondurans | 0.2 /100 | #283 | Tragic 11.9% |
| Ottawa | 0.2 /100 | #284 | Tragic 11.9% |
| Immigrants | Nicaragua | 0.2 /100 | #285 | Tragic 11.8% |
| Aleuts | 0.1 /100 | #286 | Tragic 11.8% |
| Immigrants | Haiti | 0.1 /100 | #287 | Tragic 11.8% |
| Immigrants | Honduras | 0.1 /100 | #288 | Tragic 11.8% |
| Guatemalans | 0.1 /100 | #289 | Tragic 11.7% |
| Ute | 0.1 /100 | #290 | Tragic 11.7% |
Demographics Similar to Delaware by Master's Degree
In terms of master's degree, the demographic groups most similar to Delaware are Immigrants from Jamaica (13.0%, a difference of 0.38%), Spanish American (13.0%, a difference of 0.42%), Immigrants from Bahamas (12.9%, a difference of 0.66%), U.S. Virgin Islander (13.1%, a difference of 0.70%), and Immigrants from Cambodia (12.9%, a difference of 0.70%).
| Demographics | Rating | Rank | Master's Degree |
| Jamaicans | 4.1 /100 | #237 | Tragic 13.4% |
| Hmong | 4.0 /100 | #238 | Tragic 13.4% |
| Immigrants | Nonimmigrants | 3.4 /100 | #239 | Tragic 13.3% |
| Guamanians/Chamorros | 2.2 /100 | #240 | Tragic 13.1% |
| U.S. Virgin Islanders | 2.1 /100 | #241 | Tragic 13.1% |
| Spanish Americans | 1.9 /100 | #242 | Tragic 13.0% |
| Immigrants | Jamaica | 1.9 /100 | #243 | Tragic 13.0% |
| Delaware | 1.7 /100 | #244 | Tragic 13.0% |
| Immigrants | Bahamas | 1.4 /100 | #245 | Tragic 12.9% |
| Immigrants | Cambodia | 1.4 /100 | #246 | Tragic 12.9% |
| Iroquois | 1.4 /100 | #247 | Tragic 12.9% |
| Africans | 1.4 /100 | #248 | Tragic 12.9% |
| Cree | 1.3 /100 | #249 | Tragic 12.8% |
| Liberians | 1.3 /100 | #250 | Tragic 12.8% |
| Tlingit-Haida | 1.3 /100 | #251 | Tragic 12.8% |