Immigrants from Scotland vs Delaware Master's Degree
COMPARE
Immigrants from Scotland
Delaware
Master's Degree
Master's Degree Comparison
Immigrants from Scotland
Delaware
17.4%
MASTER'S DEGREE
99.4/ 100
METRIC RATING
84th/ 347
METRIC RANK
13.0%
MASTER'S DEGREE
1.7/ 100
METRIC RATING
244th/ 347
METRIC RANK
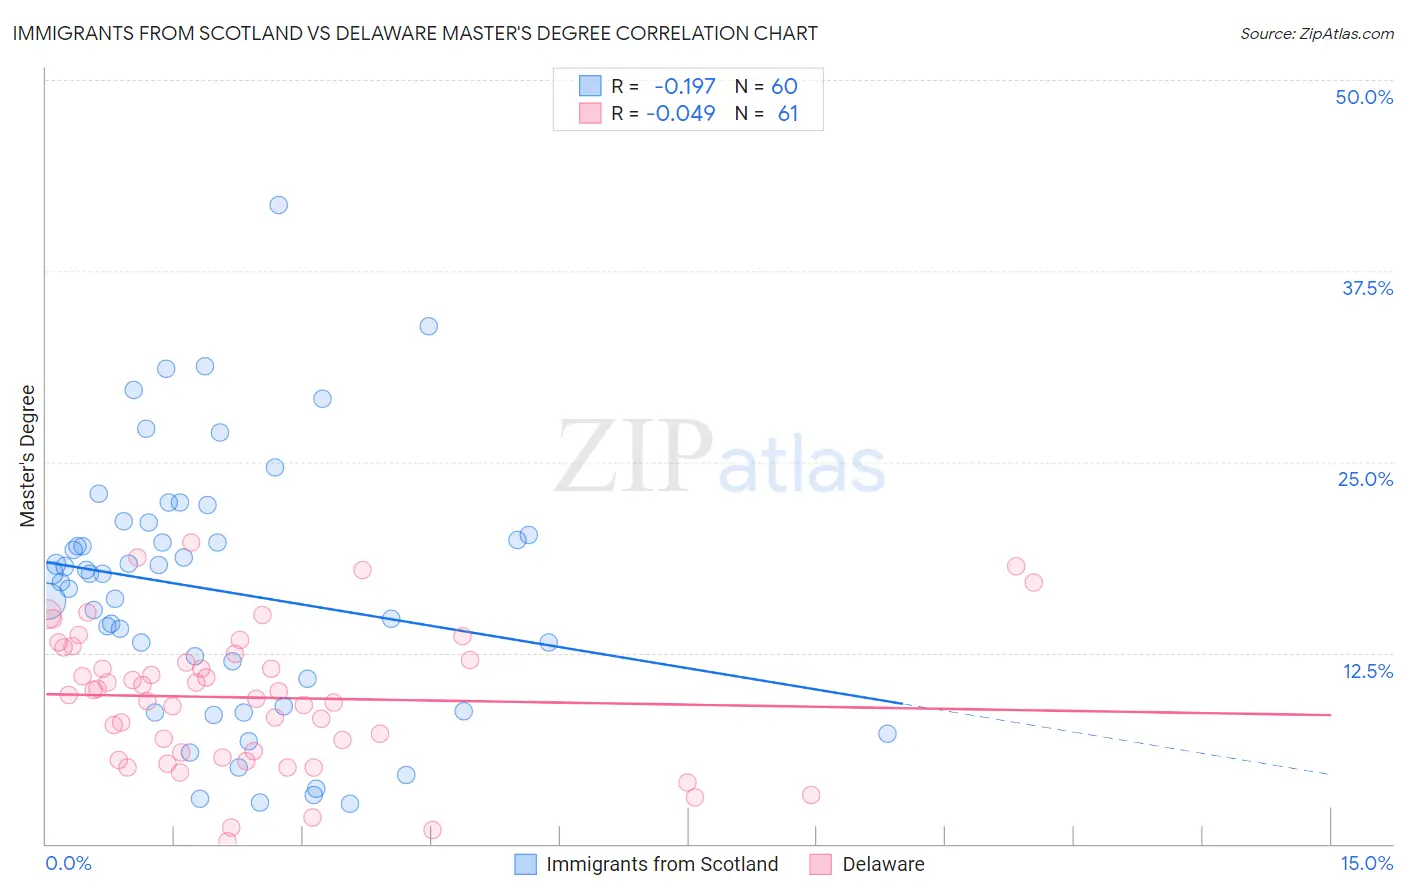
Immigrants from Scotland vs Delaware Master's Degree Correlation Chart
The statistical analysis conducted on geographies consisting of 196,383,554 people shows a poor negative correlation between the proportion of Immigrants from Scotland and percentage of population with at least master's degree education in the United States with a correlation coefficient (R) of -0.197 and weighted average of 17.4%. Similarly, the statistical analysis conducted on geographies consisting of 96,222,112 people shows no correlation between the proportion of Delaware and percentage of population with at least master's degree education in the United States with a correlation coefficient (R) of -0.049 and weighted average of 13.0%, a difference of 33.8%.
Master's Degree Correlation Summary
| Measurement | Immigrants from Scotland | Delaware |
| Minimum | 2.6% | 0.20% |
| Maximum | 41.8% | 19.7% |
| Range | 39.2% | 19.5% |
| Mean | 16.6% | 9.6% |
| Median | 17.7% | 10.0% |
| Interquartile 25% (IQ1) | 9.9% | 5.8% |
| Interquartile 75% (IQ3) | 20.6% | 12.6% |
| Interquartile Range (IQR) | 10.7% | 6.8% |
| Standard Deviation (Sample) | 8.4% | 4.6% |
| Standard Deviation (Population) | 8.3% | 4.5% |
Similar Demographics by Master's Degree
Demographics Similar to Immigrants from Scotland by Master's Degree
In terms of master's degree, the demographic groups most similar to Immigrants from Scotland are Immigrants from Brazil (17.4%, a difference of 0.18%), Immigrants from Zimbabwe (17.4%, a difference of 0.33%), Greek (17.5%, a difference of 0.39%), Immigrants from Western Asia (17.5%, a difference of 0.44%), and Immigrants from Croatia (17.3%, a difference of 0.59%).
| Demographics | Rating | Rank | Master's Degree |
| Immigrants | Eastern Europe | 99.6 /100 | #77 | Exceptional 17.6% |
| Immigrants | Hungary | 99.6 /100 | #78 | Exceptional 17.5% |
| Immigrants | Lebanon | 99.6 /100 | #79 | Exceptional 17.5% |
| Carpatho Rusyns | 99.6 /100 | #80 | Exceptional 17.5% |
| Immigrants | Western Asia | 99.5 /100 | #81 | Exceptional 17.5% |
| Greeks | 99.5 /100 | #82 | Exceptional 17.5% |
| Immigrants | Zimbabwe | 99.5 /100 | #83 | Exceptional 17.4% |
| Immigrants | Scotland | 99.4 /100 | #84 | Exceptional 17.4% |
| Immigrants | Brazil | 99.4 /100 | #85 | Exceptional 17.4% |
| Immigrants | Croatia | 99.3 /100 | #86 | Exceptional 17.3% |
| Maltese | 99.3 /100 | #87 | Exceptional 17.3% |
| Immigrants | Canada | 99.2 /100 | #88 | Exceptional 17.2% |
| Bhutanese | 99.1 /100 | #89 | Exceptional 17.2% |
| Immigrants | Egypt | 99.1 /100 | #90 | Exceptional 17.2% |
| Romanians | 99.1 /100 | #91 | Exceptional 17.2% |
Demographics Similar to Delaware by Master's Degree
In terms of master's degree, the demographic groups most similar to Delaware are Immigrants from Jamaica (13.0%, a difference of 0.38%), Spanish American (13.0%, a difference of 0.42%), Immigrants from Bahamas (12.9%, a difference of 0.66%), U.S. Virgin Islander (13.1%, a difference of 0.70%), and Immigrants from Cambodia (12.9%, a difference of 0.70%).
| Demographics | Rating | Rank | Master's Degree |
| Jamaicans | 4.1 /100 | #237 | Tragic 13.4% |
| Hmong | 4.0 /100 | #238 | Tragic 13.4% |
| Immigrants | Nonimmigrants | 3.4 /100 | #239 | Tragic 13.3% |
| Guamanians/Chamorros | 2.2 /100 | #240 | Tragic 13.1% |
| U.S. Virgin Islanders | 2.1 /100 | #241 | Tragic 13.1% |
| Spanish Americans | 1.9 /100 | #242 | Tragic 13.0% |
| Immigrants | Jamaica | 1.9 /100 | #243 | Tragic 13.0% |
| Delaware | 1.7 /100 | #244 | Tragic 13.0% |
| Immigrants | Bahamas | 1.4 /100 | #245 | Tragic 12.9% |
| Immigrants | Cambodia | 1.4 /100 | #246 | Tragic 12.9% |
| Iroquois | 1.4 /100 | #247 | Tragic 12.9% |
| Africans | 1.4 /100 | #248 | Tragic 12.9% |
| Cree | 1.3 /100 | #249 | Tragic 12.8% |
| Liberians | 1.3 /100 | #250 | Tragic 12.8% |
| Tlingit-Haida | 1.3 /100 | #251 | Tragic 12.8% |