Immigrants from Australia vs Delaware Master's Degree
COMPARE
Immigrants from Australia
Delaware
Master's Degree
Master's Degree Comparison
Immigrants from Australia
Delaware
20.9%
MASTER'S DEGREE
100.0/ 100
METRIC RATING
13th/ 347
METRIC RANK
13.0%
MASTER'S DEGREE
1.7/ 100
METRIC RATING
244th/ 347
METRIC RANK
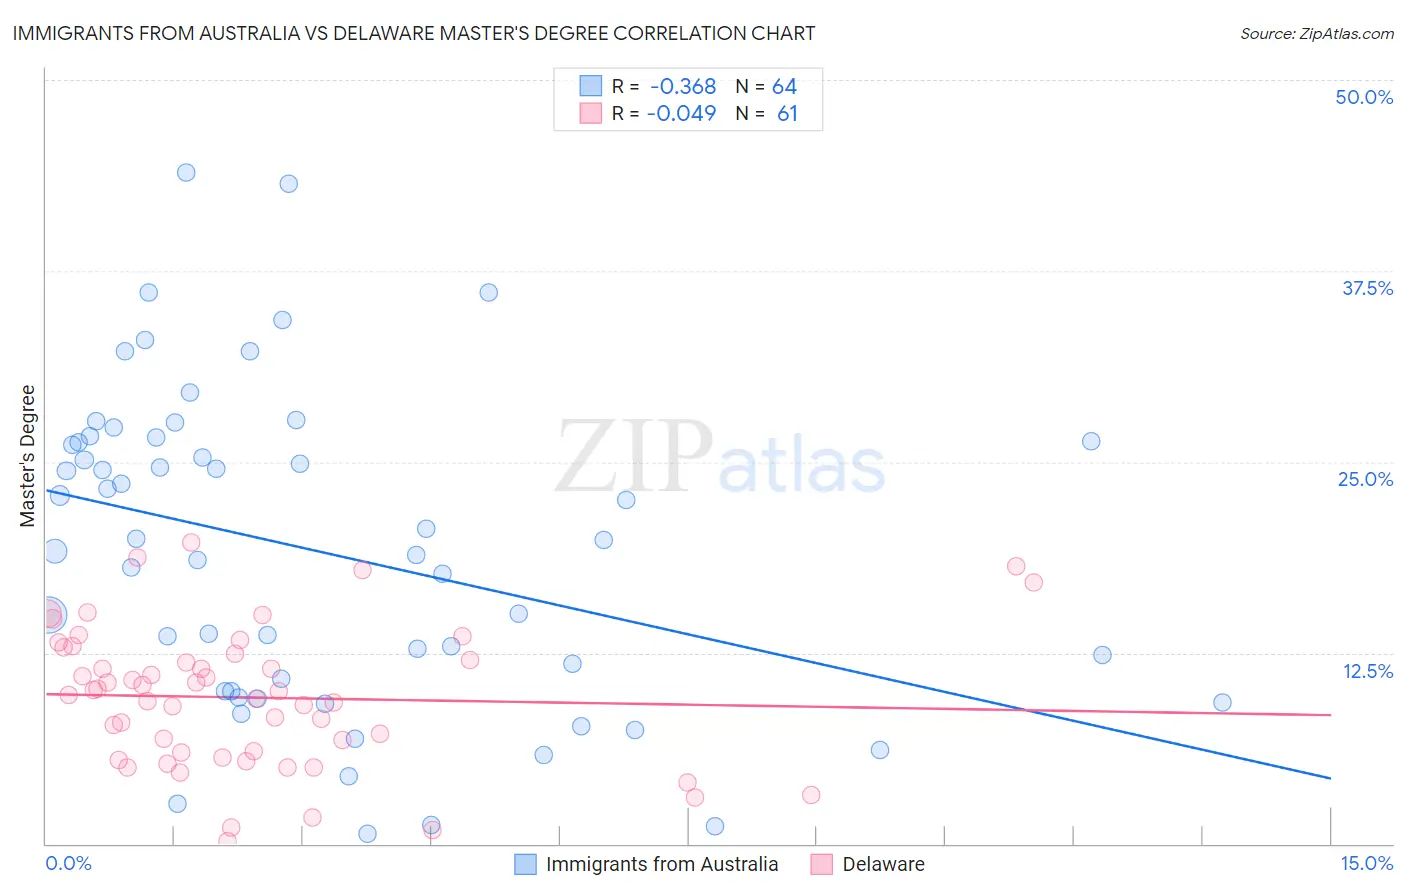
Immigrants from Australia vs Delaware Master's Degree Correlation Chart
The statistical analysis conducted on geographies consisting of 227,173,113 people shows a mild negative correlation between the proportion of Immigrants from Australia and percentage of population with at least master's degree education in the United States with a correlation coefficient (R) of -0.368 and weighted average of 20.9%. Similarly, the statistical analysis conducted on geographies consisting of 96,222,112 people shows no correlation between the proportion of Delaware and percentage of population with at least master's degree education in the United States with a correlation coefficient (R) of -0.049 and weighted average of 13.0%, a difference of 60.7%.
Master's Degree Correlation Summary
| Measurement | Immigrants from Australia | Delaware |
| Minimum | 0.65% | 0.20% |
| Maximum | 43.9% | 19.7% |
| Range | 43.3% | 19.5% |
| Mean | 19.1% | 9.6% |
| Median | 19.5% | 10.0% |
| Interquartile 25% (IQ1) | 10.0% | 5.8% |
| Interquartile 75% (IQ3) | 26.3% | 12.6% |
| Interquartile Range (IQR) | 16.3% | 6.8% |
| Standard Deviation (Sample) | 10.4% | 4.6% |
| Standard Deviation (Population) | 10.3% | 4.5% |
Similar Demographics by Master's Degree
Demographics Similar to Immigrants from Australia by Master's Degree
In terms of master's degree, the demographic groups most similar to Immigrants from Australia are Immigrants from Switzerland (20.9%, a difference of 0.010%), Immigrants from Eastern Asia (20.8%, a difference of 0.19%), Immigrants from Belgium (20.8%, a difference of 0.48%), Immigrants from South Central Asia (20.7%, a difference of 0.74%), and Eastern European (21.1%, a difference of 1.2%).
| Demographics | Rating | Rank | Master's Degree |
| Immigrants | India | 100.0 /100 | #6 | Exceptional 22.3% |
| Iranians | 100.0 /100 | #7 | Exceptional 22.3% |
| Cypriots | 100.0 /100 | #8 | Exceptional 21.8% |
| Thais | 100.0 /100 | #9 | Exceptional 21.7% |
| Immigrants | Iran | 100.0 /100 | #10 | Exceptional 21.6% |
| Immigrants | China | 100.0 /100 | #11 | Exceptional 21.2% |
| Eastern Europeans | 100.0 /100 | #12 | Exceptional 21.1% |
| Immigrants | Australia | 100.0 /100 | #13 | Exceptional 20.9% |
| Immigrants | Switzerland | 100.0 /100 | #14 | Exceptional 20.9% |
| Immigrants | Eastern Asia | 100.0 /100 | #15 | Exceptional 20.8% |
| Immigrants | Belgium | 100.0 /100 | #16 | Exceptional 20.8% |
| Immigrants | South Central Asia | 100.0 /100 | #17 | Exceptional 20.7% |
| Soviet Union | 100.0 /100 | #18 | Exceptional 20.5% |
| Immigrants | Hong Kong | 100.0 /100 | #19 | Exceptional 20.5% |
| Indians (Asian) | 100.0 /100 | #20 | Exceptional 20.5% |
Demographics Similar to Delaware by Master's Degree
In terms of master's degree, the demographic groups most similar to Delaware are Immigrants from Jamaica (13.0%, a difference of 0.38%), Spanish American (13.0%, a difference of 0.42%), Immigrants from Bahamas (12.9%, a difference of 0.66%), U.S. Virgin Islander (13.1%, a difference of 0.70%), and Immigrants from Cambodia (12.9%, a difference of 0.70%).
| Demographics | Rating | Rank | Master's Degree |
| Jamaicans | 4.1 /100 | #237 | Tragic 13.4% |
| Hmong | 4.0 /100 | #238 | Tragic 13.4% |
| Immigrants | Nonimmigrants | 3.4 /100 | #239 | Tragic 13.3% |
| Guamanians/Chamorros | 2.2 /100 | #240 | Tragic 13.1% |
| U.S. Virgin Islanders | 2.1 /100 | #241 | Tragic 13.1% |
| Spanish Americans | 1.9 /100 | #242 | Tragic 13.0% |
| Immigrants | Jamaica | 1.9 /100 | #243 | Tragic 13.0% |
| Delaware | 1.7 /100 | #244 | Tragic 13.0% |
| Immigrants | Bahamas | 1.4 /100 | #245 | Tragic 12.9% |
| Immigrants | Cambodia | 1.4 /100 | #246 | Tragic 12.9% |
| Iroquois | 1.4 /100 | #247 | Tragic 12.9% |
| Africans | 1.4 /100 | #248 | Tragic 12.9% |
| Cree | 1.3 /100 | #249 | Tragic 12.8% |
| Liberians | 1.3 /100 | #250 | Tragic 12.8% |
| Tlingit-Haida | 1.3 /100 | #251 | Tragic 12.8% |